Spatial competition with interacting agents
- Cornell University, United States
- Augustana College, United States
- Sorbonne University, France
- Northwestern University, United States
Abstract
Using agent-based modeling, we generalize Hotelling’s model of spatial competition with more than two firms in a two-dimensional space. Firms choose both price and location to maximize profits. The principle of minimum differentiation does not hold in general. Local duopolies emerge from the interaction between firms. Firms do not spread uniformly across the two-dimensional space, nor do they all charge the same price. Firms in more competitive locations charge lower prices and generate less profit.
1. Introduction
In a pioneering paper Hotelling (1929) presented a model of two firms competing to sell a homogeneous product to customers uniformly distributed along a line. Though the Hotelling model has been extended in many ways1, no one has produced a general model of spatial competition between more than two firms in a two-dimensional space, with both price and location as choice variables. The problem is important because competition in the real world seldom occurs between two firms on a one-dimensional space. Most products have multiple attributes and multiple firms supplying them.
In this paper, we develop an agent-based simulation model to study spatial competition in a two-dimensional space with multiple firms. We develop an agent-based model because it is difficult to generalize the Hotelling model using analytical methods. Interaction between firms in a two-dimensional space makes it difficult to compute the areas served by different firms. The problem has so far proved analytically intractable. In the words of mathematical economists Eaton and Lipsey (1975, p.41):
To determine if the configuration is an equilibrium one with respect to a small movement of the firm in any direction is an almost impossible task using analytical methods, and in any case much more is required to establish global equilibrium.
Eaton and Lipsey (1975) built one of the first agent-based simulation models to pursue the problem of spatial competition. They located a handful of firms on a space and numerically calculated the market area for each firm for a number of alternative locations. The technical limitations of the age meant that they could study only a few moves by each firm. We develop Eaton and Lipsey’s approach to produce a general model of spatial competition. Firms are placed on random locations on a two-dimensional grid. Customers are spread evenly across the grid. Every time step, firms make price and location choices. Firms change price or location if it is profitable to do so. The principle of minimum differentiation does not hold in general. Interactions between firms produce local duopolies, with intense local competition within coupled-firms and more stable division of customers between different couples. This is akin to how large home improvements stores like Home Depot and Lowes compete on prices, and smaller hardware stores appeal to niche markets by locating in isolated places or delivering specialized products.
Our paper is related to decades of work on generalizing Hotelling’s model. Devletoglou (1965), Jonas (1968), Drezner (1982), Tabuchi (1994), and Veendorp and Majeed (1995) study the problem of two firms on a two-dimensional space. All but Tabuchi (1994) assume both firms charge the same price. Tabuchi uses an astute transformation to study price and location choices. However the transformation is not valid for systems with more than two firms. Wendell and McKelvey (1981), Ben-Akiva, De Palma, and Thisse (1989), and Okabe and Aoyagi (1991) study a system with more than two firms in a two-dimensional space. Wendell and McKelvey (1981) explore a variety of symmetric equilibria using a “guess and check” method under the assumption that all firms charge the same price. Ben-Akiva et al. (1989) allow firms to charge different prices but fix location along one dimension. Okabe and Aoy-agi (1991) allow firms to choose location along both dimensions but assume all firms charge the same price. Irmen and Thisse (1998) and Hehenkamp and Wambach (2010) study competition between two firms in higher dimensional spaces. They characterize a subset of equilibria for which analytical solutions exist. Caplin and Nalebuff (1991) prove the existence of equilibrium for any number of firms in high dimensional spaces. But they assume location is not a choice variable.
Most authors assume either price or location is fixed. Despite the simplification, they often study a subset of equilibria using “guess and check” methods. Though some equilibria can be characterized by the ‘guess and check’ approach, it is difficult to say whether these represent a non-trivial portion of the universe of equilibria. Furthermore, there is little reason to believe that the equilibria that are the least difficult to characterize are economically the most relevant.
Overall, it is fair to say that the problem of spatial competition with both price and location as choice variables remains open. If a good many mathematical economists are to be believed, then the problem of computing analytical solutions of a general model of spatial competition is “very tedious” (Irmen & Thisse, 1998, 84), perhaps “impossible” (Jonas, 1968,17). Future developments in mathematical methods may allow economists to develop analytical solutions of general spatial competition. But we need not sit idle until then. The mathematical intractability of the problem begs for a whole new approach. Agent-based modeling is one such approach. Recent developments in computing technology allow us to build and study synthetic economies populated with artificial agents in silico Axtell (2000). Some consider agent-based modeling as a ‘new mathematics’ for social science Borrill and Tesfatsion (2011); Maroulis et al. (2010); Wilensky and Rand (2015). Others have called it a ‘third way of doing science’ because it contains elements of deduction and induction Axelrod (1997). We present an agent-based implementation of the Hotelling model with many firms in a two-dimensional space. In addition to characterizing equilibria, our model sheds light on out-of-equilibrium dynamics. The following sections will develop the model, present the simulation results, and provide concluding discussion and remarks.
2. The model
There are two types of agents: firms and customers. Firms are initially randomly placed on points in a two-dimensional grid cell coordinate system. Each square patch in the grid is a customer. Three events occur every time step. One, each customer buys one unit of the good from its lowest cost firm. Two, firms evaluate moving to a different location in the two-dimensional space and changing their price. Three, firms simultaneously exercise their location and price choices. We run the economy forward in time and analyze the resulting data. The model is written in the NetLogo agent-based modeling language Wilensky (1999). The model is included in the NetLogo model library as the Hotelling’s Law Model Ottino, Stonedahl, and Wilensky (2009), and is freely available online at http://ccl.northwestern.edu/netlogo/models/Hotelling’sLaw.
Pseudocode for the agent-based model.
| Initialization: |
| customer agents placed on each lattice point of 41x41 grid. |
| for each firm Fi ∈ F1, F2, …, FN: |
| place firm Fi on a random lattice point. |
| set initial price for Fi ← 10 |
| Each time step: |
| let M (the set of movement actions) = |Up, Down, Left, Right} |
| let P (the set of price change actions) = |+1,-1} |
| for each firm Fi: |
| Fi selects mi ∈ M s.t. calculatedProfitAfter(mi) is maximized |
| Fi selects pi ∈ P s.t. calculatedProfitAfter(pi) is maximized |
| for each firm Fi: |
| Fi takes actions mi and pi |
| for each customer Cj: |
| Cj selects firm Fmin s.t. price(Fmin) + transportationCost(Fmin, Cj) is minimized. |
| Cj purchases one unit of the good from Fmin |
2.1 Firms
The cost of production is zero; profit equals revenue. Firms begin with randomly assigned locations and price often. Every time step, firms compute the profit from a one unit move in each of the four cardinal directions. They move to the point with the greatest profit. Firms do not move if the profit at the present location is greater than the profits at any of the four alternative locations. Every time step, firms compute the profit from a one unit increase and a one unit decrease in price. They choose to charge the price that yields the greatest profit. Firms do not change price if the present price offers a profit greater than the alternatives.
Firms compute profits from potential changes in location and price by collecting demand information from all customers. Customers truthfully report whether they would buy from a firm given its location and price. Firms incur no cost of moving locations, changing price, or collecting information. While making location and price decisions, each firm assumes that all other firms will remain at the current locations and charge existing prices. In other words, we assume ‘zero conjectural variation’.
2.2 Customers
Every time step, customers compute the cost of buying from all firms on the grid. The cost of a good is the sum of the price charged and the distance to the firm. The distance equals the Euclidean norm. Every time step, each customer buys one unit of the good from its lowest cost firm (demand is price inelastic). When indifferent between multiple firms, customers randomly select one firm from the indifference set.
2.3 Experiments and data collection
For the experimental results that follow, we consider three variations of this model: (i) where firms may change both their price and their location, (ii) where firms may only change location but prices are fixed (constant and equal to all competitors), (iii) where firms may only change their price, but locations are fixed (at the randomly initialized position).
For each of these variations, and for varying numbers of firms (2…10), we ran 500 replicate simulations. Each simulation was performed using a 41x41 grid cell coordinate system (representing 1681 customers), for 1000 simulated time steps. Data collected included the final positions of each firm, the price each firm was charging for the product, and the area of patronage (number of customers) each firm had captured in the market. The results from these main experiments are described below, followed by a discussion of some follow-up experiments that were performed for the sake of sensitivity analysis.
3. Results
Result 1 The principle of minimum differentiation does not hold in general
Hotelling (1929) found two firms competing on a line choose to locate next to each other. This came to be known as the principle of minimum differentiation. Hotelling himself, and many since, claimed the principle explains a variety of phenomena including why political parties are all alike Boulding (1955); Downs (1957).
Previous economists have shown the principle of minimum differentiation is sensitive to the assumptions of Hotelling’s model. In particular, economists have proved that the principle does not hold if demand is price elastic Devletoglou (1965); Hartwick and Hartwick (1971); Lerner and Singer (1937); Robinson (1941); Smithies (1941) or if transportation costs are non-linear d’Aspremont, Gabszewicz, and Thisse (1979). In contrast, our model matches Hotelling’s original assumptions that demand is price inelastic and transportation costs are linear.
For a discrete two-dimensional space, we find that the principle of minimum differentiation holds when there are two firms, but does not hold when there are three or more firms. From the very beginning, Hotelling’s original claim that the principle of minimum differentiation holds for three stores was challenged Chamberlin (1933); Lerner and Singer (1937), eventually establishing that there is no general equilibrium for precisely three stores on the one-dimensional interval. For two-dimensional market spaces where firms choose location but price is fixed, Eaton and Lipsey (1975) hypothesize (but were unable to prove) that no equilibria exist for 3 or more firms. The potential lack of equilibria may have dashed hopes of solving for eventual steady-state configurations, but it does not settle the question of what non-equilibrium behavior would occur with three stores, and whether it would more closely approximate the principle of minimum differentiation, maximal differentiation, or somewhere in between. Agent-based simulation offers an approach that can explore model dynamics in such cases, and track the evolution of competition over time.

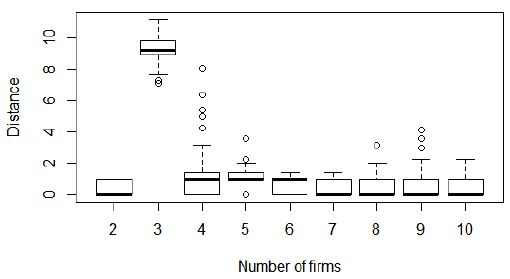
Minimum distance to nearest when firms choose locations but prices are fixed.
Notes: Data plotted from 500 replicate simulation runs for each case (2 through 10 firms).
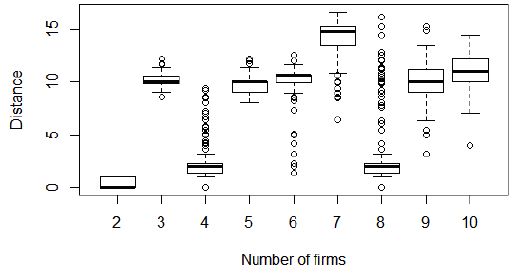
Maximum distance to nearest firm when firms choose locations but prices are fixed.
Notes: Data plotted from 500 replicate simulation runs for each case (2 through 10 firms).
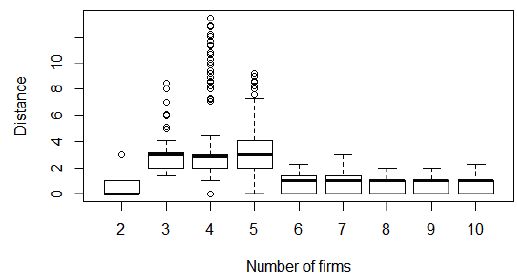
At the end of every simulation, the distance between each firm and its nearest competitor was recorded. Figures 1 and 3 plot the minimum distances, while Figures 2 and 4 plot the maximum distances at the end of every simulation. Figures 1 and 2 pertain to the case when firms choose locations but prices are fixed. Figures 3 and 4 pertain to the case when firms choose both locations and prices. Figures 1–4 show that with two firms the minimum and maximum distances are either 0 or 1. The two firms are either on the same location or adjacent to each other. Firms in our model seek local improvements assuming their competitor will maintain price and location. The two firms pivot around each other producing a distance of 1 in some cases and 0 in others. When three firms choose location, but not price, they form a gyrating equilateral triangle. This configuration appears relatively stable, since each store ends up losing some market share if it either moves in between the other two firms (closer to the center), or moves away from the other two firms toward the boundary. When three firms choose both price and location, the resulting pattern tends to involve the three firms forming a line, with two firms locked close together in fierce price competition and the third firm positioned further away. With more than three firms, firms arrange themselves in many different constellations (some of which are shown in Figures 6 and 7). Figures 2 and 4 demonstrate that some firms are not especially close to any other firm, and do not form one large cluster; thus, the principle of minimum differentiation does not hold.

Minimum distance to nearest firm when firms choose both prices and locations.
Notes: Data plotted from 500 replicate simulation runs for each case (2 through 10 firms).
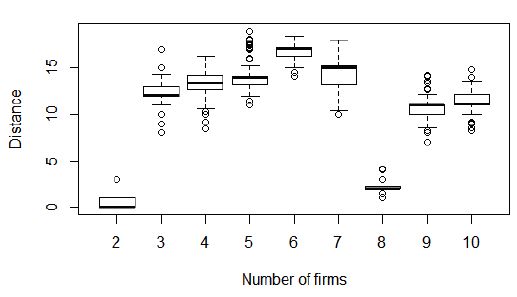
Maximum distance to nearest firm when firms choose both prices and locations.
Notes: Data plotted from 500 replicate simulation runs for each case (2 through 10 firms).
Result 2 Local duopolies emerge from the interaction between firms
An emergent property of the system is that firms form pairs, but never triples or groups of other sizes. This result is consistent with the “principle of local clustering” finding of Eaton and Lipsey (1975), although their model did not include firms’ ability to change prices, and used a 2-D disc shape rather than a rectangular section of the plane. Lone firms have a tendency to move towards other lone firms near them. However, pairs of firms do not together move towards other pairs. Rather they engage in intense competition with each other. Lerner and Singer (1937) and Chamberlin (1953) showed that in equilibrium some firms form pairs in the one-dimensional case. They argued firms at the edges must necessarily forms pairs because otherwise they have a tendency to approach the center. We do not find this to be true in the two-dimensional case. Singleton firms may exist in the periphery. Unlike in one-dimension, in two-dimensions a firm may lose some of its customers to other firms if it approaches the center from the periphery.
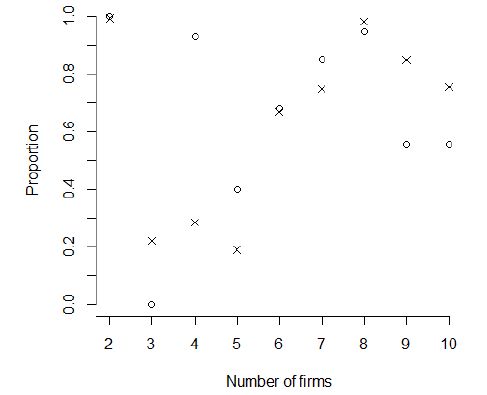

Proportion of firms that form local duopoly pairs (less than 3 units distance from one other firm at the end of the simulation run).
Notes: Circles mark the case when firms choose locations but prices are fixed. Crosses mark the case when firms choose both locations and prices. Each data point represents the mean value from 500 replicate simulation runs.
Figure 5 shows the proportion of firms that form pairs. In most cases, a significant proportion of the firms form pairs. The notable exception to pair formation is when there are three stores that are choosing location but have fixed (equal) prices; in this case, the three stores tend to roughly form the shape of a rotating equilateral triangle. Figures 6 and 7 show the characteristic spatial locations along with the path taken by the firms. Table 1 lists the prices of firms in Figure 7.
Result 3 Firms charge lower prices in more competitive regions
This result is not surprising, but it is nice to see that it naturally emerges from the basic model rules. Firms with other firms near them charge low prices, whereas firms far away from competitors charge high prices. Some firms compete over large central areas by charging low prices, while other firms move to the periphery to occupy smaller regions charging high prices. This characteristic pattern can be observed in Table 1 and Figure 7 parts (b) and (c), where the firms labeled C and L are charging substantially higher prices than the firms that paired up and are engaged in price wars with their nearest competitor.
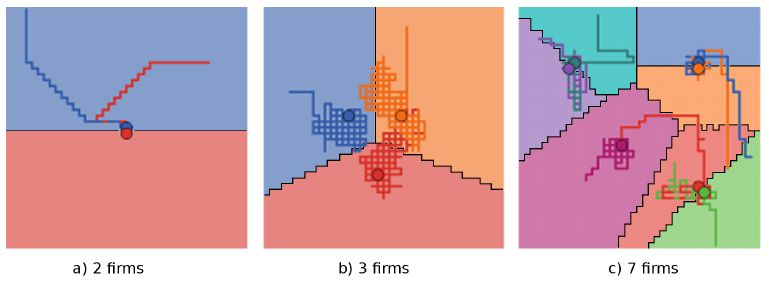

Characteristic locations with two, three and seven firms when firms choose locations but prices are fixed.
Notes: Firms are represented by circles, each filled in with a distinct color. The grid cells, each representing a customer, are colored using a lighter shade of the same hue as the firm which they currently patronize. The history of firms’ movement is shown as a trail of corresponding color.
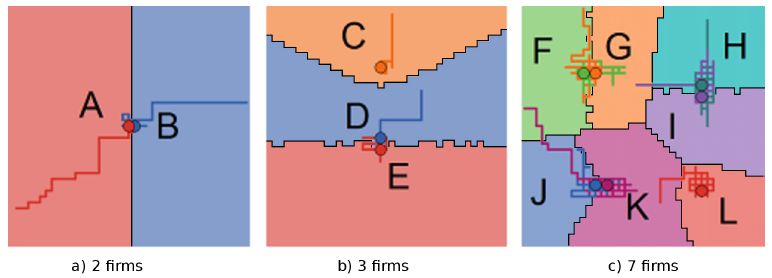

Characteristic locations with two, three and seven firms when firms choose both prices and locations.
Notes: Visualization of firms and customers’ patronage is the same as described in Figure 6 above.
Selling prices for the firms shown in Figure 7.
| Region | A | B | C | D | E | F | G | H | I | J | K | L |
| Price charged | 1 | 1 | 8 | 2 | 2 | 2 | 2 | 3 | 3 | 2 | 3 | 10 |
-
Notes: Firms positioned farther apart from others (e.g., C and L) charge higher prices than firms in competitive local duopolies, because they are able to raise prices without losing as many customers as firms who have nearby competitors.
Figure 8 displays plots of the relations between prices and distance to the nearest competitor. These plots demonstrate that there is a positive relation between the distance to the nearest competitor and price. The greater the distance to a competitor, the lower the level of competition, and greater the price. Note that the prices are much lower in the case where the firms choose both location and price; the ability of firms to move toward one another prevents any firm from profitably setting extremely high prices. Also, the tendency to form pairs with extremely low prices puts downward price pressure even on the unpaired stores at a distance.
Figure 9 displays plots of the firms’ profits versus prices. As profit is the product of a firm’s price and customer base, higher priced firms could earn less profit if they serve a tiny niche market. However, this model shows a strong positive correlation between price and profit. Firms that position themselves far away from their nearest competitors charge higher prices while maintaining a sizable customer base, and thus reap greater profits.
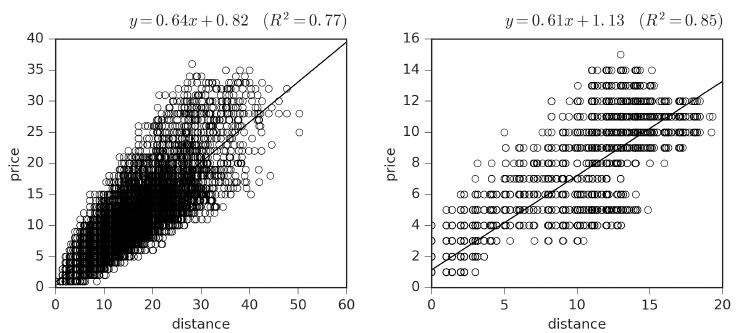

Price versus distance to nearest competitor when firms choose prices but locations are fixed (left panel) and when firms choose both locations and prices (right panel).
Notes: Data plotted from each firm from all of the 4500 simulations involving 2 to 10 firms.
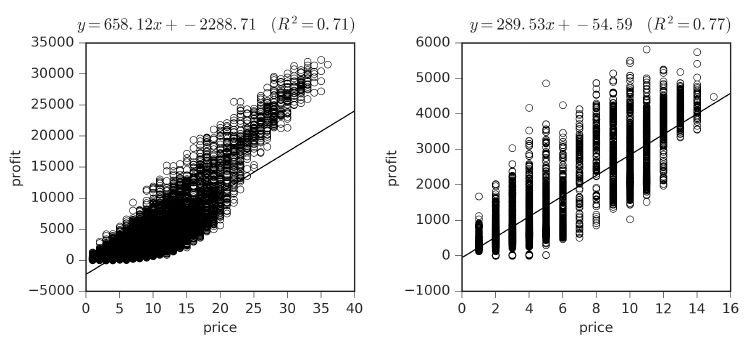

Profit versus price when firms choose prices but locations are fixed (left panel) and when firms choose both locations and prices (right panel).
Notes: Data plotted from each firm from all of the 4500 simulations involving 2 to 10 firms.
4. Sensitivity analysis
We performed additional experiments to test the robustness of these results by relaxing several model assumptions. Specifically, using the model that includes both movement and price changes, we explore the impact of:
imperfect information in the firms’ expectation formation process
irrationality within customer agents’ purchasing decisions
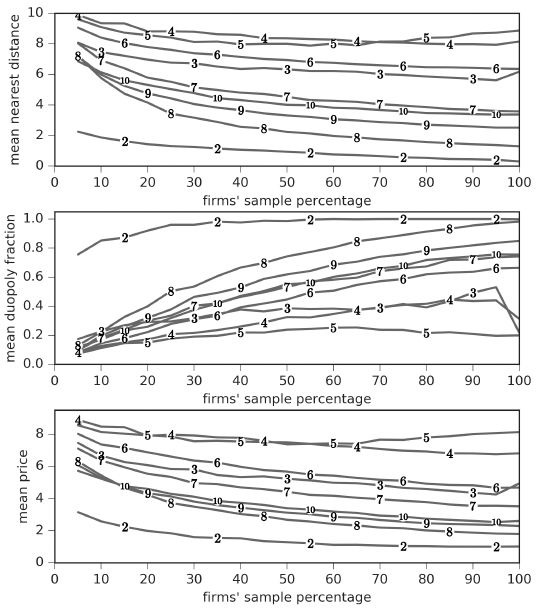
Imperfect information was modeled by limiting the firms’ ability to obtain perfect information about consumer demand when considering hypothetical location/price changes. Specifically, we introduced a parameter (firms’ sample percentage) that controls what percentage of the market firms could query. Each time a firm would query customer demand, a random fraction of the customers would respond, which could contribute to noise in the decision process. A more general interpretation of this parameter is that it specifies firms’ ability to accurately estimate market demand. The results of an experiment varying this sampling percentage from 5% through 100% are shown in Figure 10.

Sensitivity analysis for the distance between nearest firms (top panel), the fraction of firms involved in local duopolies (middle panel), and the average price (bottom panle), with respect to firms’ sampling percentage (what fraction of consumers each firm surveys about potential patronage during decision-making).
Notes: Each data point represents the average across 500 simulation runs on a 41x41 grid.
We report several key measures (average distance to nearest competitor, average number of stores engaged in local duopolies, and average price). These measures are largely robust to imperfect information, and even at relatively low sampling percentages (for instance 15%), the main results hold: a) the principle of minimum differentiation does not hold for more than two firms, b) a significant (albeit smaller) fraction of stores form pairs, and c) firms charge less in more competitive regions. While information degradation tends to lead to fewer local duopoly pairs, a small amount of imperfect information causes an increase in pairings in the 3-firm case, possibly by injecting enough randomness to disrupt the semi-stable triangular symmetry that sometimes forms.
Irrationality was modeled by introducing a parameter (customer rationality percentage) that controls the chance of each customer acting rationally (patronizing the least cost firm), as opposed to patronizing a random store. This might be construed as situations where a customer is desperate for the product or preoccupied by other matters, and purchses blindly without doing any comparison shopping/research. This parameter similarly controls the chance that a customer would report demand rationally to firms when queried, thus resulting in a different type of noise to the firms’ expectation formation process.
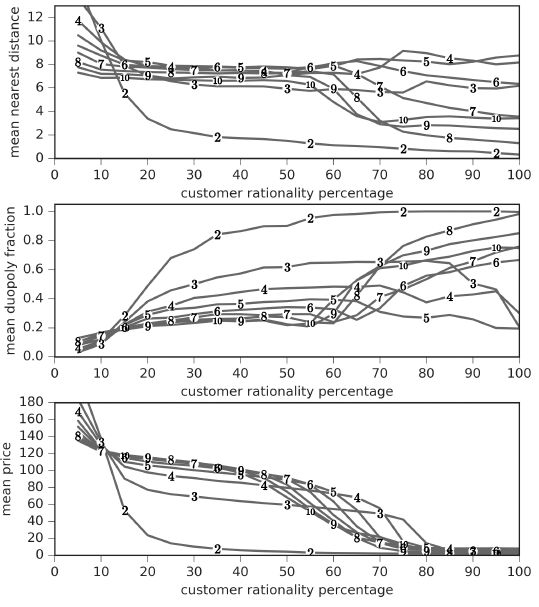
Sensitivity analysis for the distance between nearest firms (top panel), the fraction of firms involved in local duopolies (middle panel), and the average price (bottom panel), with respect to customer rationality (the percent chance that each customer will choose to patronize their minimal cost firm, instead of choosing randomly among all firms).
Figure 11 shows the results for varying degrees of customer rationality. Once again, the results of this paper hold for less than perfect rationality. In this case, key model measures are highly robust down to approximately 80% rationality, below which some qualitatively different patterns begin to emerge. When customers becomes sufficiently irrational, some firms (generally those not involved in local duopolies) begin to continually raise prices, losing all market share save for the irrational customers who randomly choose them (and are willing to pay any price).
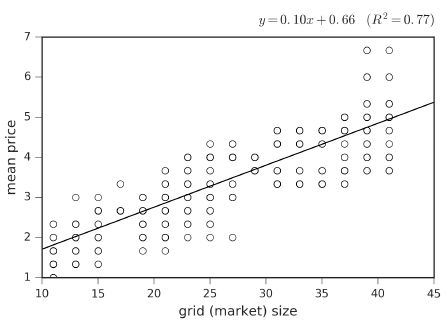
Additionally, we performed simulations with varying market sizes (smaller and larger grids than the 41x41 used for the main experiments). These simulations yielded qualitatively similar results to those presented here. The model is not particularly sensitive to the market size parameter, although smaller markets generally lead to greater competition and thus lower prices as one would expect. For example, see Figure 12, which shows how the average price increases as the market size increases.

Average price versus grid size for 3 firms that are choosing both location and price.
Notes: Results shown are from 50 replicate simulations for each grid size, which ranged from 11 to 41 by increments of 2.
5. Concluding remarks
Economists have long known that firms compete not just on prices but also on the nature of the product. The product itself is an economic variable Chamberlin (1953). In a pioneering article, Hotelling (1929) developed a formal framework to study price and product competition. Though over 85 years have passed since Hotelling’s contribution, no one has extended the model to two dimensions with multiple firms making price and location choices. The problem has proved analytically intractable.
We solve the problem using agent-based simulation, demonstrating that agent-based approaches can offer additional insight into problems of economic theory that are very difficult (if not impossible) to approach analytically.
Our model is a highly stylized depiction of the complex realities of price and product competition. However, one of the hallmarks of the most successful agent-based models, such as the Schelling (1971) segregation model2, is the model’s ability to demonstrate that even very simple agent rules can lead to the emergence of complex behavior. Such is the case with the two-dimensional spatial competition model presented here, which shows how the preservation of differentiation, the formation of local duopolies, and niche market pricing can all arise from the iteration of simple local decision-making rules. To gain further insight into these mechanics, this simple base model could be extended to include demand elasticity, asymmetric information, various interaction topologies, different distribution of customers, and higher-dimensional spaces. Additional consideration about firms’ decisionmaking processes and estimation of the expected profit of changing location/price would also be interesting. For instance, the firm agents might use reinforcement learning or neural networks, and include memory of past actions, and the firms could consider more than incremental changes in strategy. We hope that this model and future agent-based models inspired by it will enable greater exploration of multivariable economic competition and foster further investigation into out of equilibrium dynamics. More generally, agent-based modeling presents opportunities for exploring the state-space of models of economic competition in ways that more traditional analytical methods have not.
Footnotes
1.
Economists have applied Hotelling’s model to study a wide variety of phenomenon including political competition Roemer (2009), agglomeration in cities Fujita and Thisse (2013), product differentiation Meagher and Zauner (2004), price-increasing effects of competition Chen and Riordan (2008), the dynamics of resource extraction Lin and Wagner (2007), and the relation between prices and market integration Asche, Bremnes, and Wessells (1999). Theoretical work has extended Hotelling’s model to include uncertainty Meagher (2012), transportation costs Anderson (1988), different distributions of customers Gupta, Pal, and Sarkar (1997), endogenous number of firms Götz (2005), and elastic demand for product Puu (2002).
2.
See http://cel. northwestern. edu/netlogo/models/segregation for a NetLogo implementation of Schelling’s classic segregation model.
References
-
1
Equilibrium existence in the linear model of spatial competitionEconomica 55:479–491.
-
2
Product aggregation, market integration, and relationships between prices: An application to world salmon marketsAmerican Journal of Agricultural Economics 81:568–581.
-
3
Advancing the art of simulation in the social sciencesIn: R Conte, R Hegsel-mann, P Terna, editors. Simulating social phenomena. Springer. pp. 21–40.
-
4
Center on Social and Economic Dynamics, The Brookings InstitutionCenter on Social and Economic Dynamics, The Brookings Institution.
-
5
Spatial competition with differentiated productsRegional Science and Urban Economics 19:5–19.
-
6
The elgar companion to recent economic methodologyAgent-based modeling: The right mathematics for the social sciences?, (Eds.), The elgar companion to recent economic methodology, Edward Elgar Publishing.
- 7
-
8
Aggregation and imperfect competition: On the existence of equilibriumEconometrica 59:25–59.
- 9
- 10
- 11
- 12
- 13
-
14
Aneconomictheoryofpolitical actioninademocracyJournal of Political Economy 65:135–150.
-
15
Competitive location strategies for two facilitiesRegional Science and Urban Economics 12:485–493.
-
16
The principle of minimum differentiation reconsidered: Some new developments in the theory of spatial competitionThe Review of Economic Studies 42:27–49.
-
17
Economics of agglomeration: Cities, industrial location, and globalizationCambridge University Press.
-
18
Endogenous sequential entry in a spatial model revisitedInternational Journal of Industrial Organization 23:249–261.
-
19
Spatial cournot competition and agglomeration in a model of location choiceRegional Science and Urban Economics 27:261–282.
-
20
Duopoly in spaceThe Canadian Journal of Economics/Revue canadienne d’Economique 4:485–505.
-
21
Survival at the center: The stability of minimum differentiationJournal of Economic Behavior & Organization 76:853–858.
- 22
-
23
Competition in multi-characteristics spaces: Hotelling was almost rightJournal of Economic Theory 78:76–102.
-
24
Spatial competition in a two dimensional marketThe Annals of Regional Science 2:12–29.
-
25
Some notes on duopoly and spatial competitionThe Journal of Political Economy 45:145–186.
-
26
Steady-state growth in a hotelling model of resource extractionJournal of Environmental Economics and Management 54:68–83.
- 27
- 28
-
29
Product differentiation and location decisions under demand uncertaintyJournal of Economic Theory 117:201–216.
-
30
Existence of equilibrium configurations of competitive firms on an infinite two-dimensional spaceJournal of Urban Economics 29:349–370.
-
31
http://cel.northwestern.edu/netlogo/models/Hotelling’sLawNetLogo Hotelling model.
-
32
Hotelling ice cream dealers with elastic demandThe Annals of Regional Science 36:1–17.
- 33
- 34
- 35
- 36
-
37
Two-stage two-dimensional spatial competition between two firmsRegional Science and Urban Economics 24:207–227.
-
38
Differentiation in a two-dimensional marketRegional Science and Urban Economics 25:75–83.
-
39
New perspectives in competitive location theoryEuropean Journal of Operational Research 6:174–182.
-
40
http://ccl.northwestern.edu/netlogo/Netlogo.
-
41
An introduction to agent-based modeling: Modeling natural, social, and engineered complex systems with NetLogoMIT Press.
Article and author information
Author details
Publication history
- Version of Record published: December 31, 2017 (version 1)
Copyright
© 2017, Ottino-Loffler et al.
This article is distributed under the terms of the Creative Commons Attribution License, which permits unrestricted use and redistribution provided that the original author and source are credited.