Accrued pension rights in Belgium: Micro-simulation of reforms
- Université de Liège, Belgium
Abstract
We simulate different reform scenarios of the Belgian pension system using a microsimulation approach. Using a rich administrative dataset with extensive information on individual earnings histories, we evaluate the impact of the scenarios for the individuals as well as the system as a whole. Our main metric for these analysis is the notion of accrued to date pension rights, i.e. the pensions rights that would be due if the system were shut down today and all accrued rights under current legislation were honoured. Our analysis illustrates that partial reforms have limited effects, both in distributional and in fiscal terms. To achieve more substantial effects, a more comprehensive approach is needed. Regional differences within the country are mostly due to differences in regional GDP rather than the pension system itself.
1. Introduction
Pension systems all across the developed world are under pressure. While some issues are purely crisis-related, others are more structural and overall harder to address (consider the issue of increased longevity combined with early retirement). The Belgian pension system is no exception to this rule, and thus a thorough study of it and possible reforms to it seem more than warranted. Our approach is to focus on a set of hypothetical reform scenarios rather than follow the reform as recently initiated by the Di Rupo government.1 While this focus on hypothetical reforms scenarios might at first look like reducing the relevance of the research, it actually enriches the debate as it illustrates the impact of a much wider set of policy measures going well beyond the current reform compromise – that will for sure not be the final stage of the pension reform process.
To evaluate various reform proposals, two broad strategies are possible. One is to rely on macroeconomic aggregates, and consider a simple overall effect of changing major pension rules. The second one is to focus on the population’s real earnings and career history to determine how various reforms affect not only the aggregate economy but also each individual. The present paper follows the second approach. We use an administrative dataset characterized by a large sample size and detailed information regarding the numerous parameters that enter the pension formulae of the various pension systems in Belgium. The data allows a multi-faceted analysis of how various scenarios will impact the pension system in terms of costs, but also in terms of distributional outcomes. We consider two dimensions. First, we explore how various reforms scenarios impact on the average pension entitlements of individuals of different age cohorts. This has immediate consequences for the aggregate (fiscal) cost of the pension system – and we also present estimates of shutdown costs of the current pension systems. Second, we consider the distributional consequences of reforms on the population using a variety of inequality indicators. One specific form of distributional analysis we perform is decomposition by region (Flanders, Wallonia, Brussels) to illustrate potential redistributive and fiscal consequences of a de-federalization of the system.
Our paper is structured as follows. Section 2 describes the Belgian pension system that is the background for our analysis. Section 3 outlines the key characteristics of the dataset used while Section 4 presents the proposed reform scenarios. Section 5 discusses our simulation results and highlights key findings with respect to intergenerational distribution, intragenerational distribution and the fiscal consequences for the public budgets. Finally, Section 5 concludes.
2. The belgian pension system
There are three main social insurance regimes, for wage-earners, self-employed and the civil servants respectively. They have in common that benefits are computed based on earnings during periods of affiliation – though specific rules differ quite substantially across systems and across time.2
The benefit formula for wage earners can be represented as follows:
Benefit =n/N * k * average wage
where n represents the number of years of affiliation with the wage-earner’s scheme, N the number of years required for a full career. For our reference year of 2001, N is 45 for men and varies between 42 and 45 for women depending on their year of birth. Similarly, the normal retirement age for women in our sample varies from 62 to 65 depending on their birth cohort while for men it is universally set at 65. k is a replacement rate, which takes on the value of 60% and 75% depending on whether the social security recipient claims benefits as a single or as a married couple.3 The variable “average wage” corresponds to indexed average wages over the period of affiliation, with indexation based on the price index combined with additional discretionary adjustments for the evolution of growth, and subject to a minimum right per career year evaluated at the moment of retirement.
A peculiar – and heavily used – feature of the Belgian wage-earners scheme is that periods of the life spent on replacement income (unemployment benefits, disability benefits, workers compensation, etc.) are treated in a fully equivalent way to work periods. In line with a general philosophy that such spells on a replacement income is purely involuntary, imputed wages for these periods are set equal in real terms to the workers’ earnings before entering these replacement income programs. Another feature of the system is that minima (and maxima) have progressively increased in practical importance through more generous automatic and discretionary increases of minima as compared to other pensions. In protecting people against bad life outcomes, minima and imputed earnings interact.
The second regime, for self-employed, is closest in design to the wage-earner scheme. Benefits are computed based on a comparable formula, with the exception that average declared wages are substantially lower than those of wage earners. This has led to a situation where minima have for a long time played a predominant role in the determination of benefit levels. Also, normal retirement ages for men and women are similar to the ones prevailing in the wage earner scheme.
The civil-servant regime is the most distinct in design and the most generous of the three. Pensions are based on the income earned by an individual during the last 5 years before retirement – thus resembling a final-wage pension scheme rather than the career average philosophy in the other regimes. Benefits are independent of family status, which is yet another distinguishing factor with the other regimes. They are computed according to a rather complicated formula that depends on the rank and career length of an individual but can never exceed 75% of the average wages over the last five years. The benefit formula can be represented as follows:
Benefit = average wage over last five years * min [fract ; 0.75]
where fract is a fraction with a numerator consisting of the number of years the person worked in the public service, and the denominator being a benefit accrual factor. This latter benefit accrual factor called “jaarlijks/tantième” depends on the rank the person occupies in the hierarchy – as does the normal age of retirement of the civil servant. In practice, the benefit accrual factor takes on values ranging from 12 to 60, taking the value of 12 for the highest ranking civil servants (provincial governors) during their first 7 years of service and 60 for the lowest ranks.4
In addition to the relative limit on pensions of 75% of the average final-career wage, there is also an absolute limit to the amount of a public sector pension, both a ceiling and a floor.
3. Data
We use a rich individual-level dataset that contains a large array of administrative information including demographic characteristics and earnings histories. The main data source is the “Datawarehouse Labor Market and Social Protection” (in short “the Datawarehouse”). It is administered by a specialized public institution – the Crossroads Bank for Social Security (CBSS). The role of the CBSS is to pool on a continuous basis a large array of individual-level administrative information originating from the various operational social insurance agencies. It contains information on the current labor market status of individuals, but also allows a rich view of the past earnings and social insurance record.5
Our sample was generated within the framework of the large-scale government funded research project MIMOSIS. For the reference year of 2001, individuals were randomly selected to construct a representative sample of the Belgian population. Out of a total of 305.019 individuals, we focus our attention on those individuals that are in an age range where it is still (possible) to accrue rights in the system. We are thus left with a sample of 164.353 individuals aged from 18 to 64 and not defined as pensioner or dependent children.6
We focus on individuals that were not yet retired in 2001. We use administrative data from the National Register (demographics) and the “Datawarehouse” (labor markets). Information includes amongst others the wages earned during each career-year worked as a wage earner enriched by relevant complements regarding the full or part-time nature of the job, as well as any periods of time spent on benefit receipt within other social programs.7 For self-employed, we only have limited information including the current income level and the initial affiliation date as a self-employed. For civil-servants, maybe somewhat surprisingly, the information on wages and other relevant career data is most sparse and strictly limited to the year of observation 2001 as there was no centralized database of earnings histories in the public sector. In practice, this means that we have to extrapolate pension entitlements from a single annual wage observation, obviously taking into consideration any extra career information that is available in other records (e.g. periods spent in the other pension systems).8
Applying the population weights to the dataset, Table 1 summarizes the characteristics of the corresponding population for Belgium. The most remarkable facts are: i) the dramatic decline in the percentage of wage-earners with age, from 60.6% to 16.8% across the 25–34 and the 55–64 years old cohorts; ii) the simultaneous increase in the percentage of civil servants, from 5.2% in the 25–34 years old to 16.0 % in the 45–54 cohort, and in the percentage of workers in the sick/disabled/unemployed/pre-retired categories, which represent more than 30% of total population in the 55–64 years old cohort against 10% among the young 25–34 cohort; and iii) the importance of the category “others” at higher ages which is composed of former workers, mainly women currently out of the labor market
Population aged 18–64, excluding pensioners and dependent children (in %) Belgium (1/1/2002).
| Gender and labor market situation | Age | Total | ||||
|---|---|---|---|---|---|---|
| 18–24 | 25–34 | 35–44 | 45–54 | 55–64 | ||
| Gender | ||||||
| Men | 52.8 | 50.4 | 50.5 | 50.3 | 51.3 | 50.3 |
| Women | 47.2 | 49.6 | 49.5 | 49.7 | 48.7 | 49.7 |
| Labor market situation | ||||||
| Wage earners | 78.6 | 60.6 | 50.9 | 37.8 | 16.8 | 46.9 |
| Self-employed | 4.2 | 8.8 | 11.9 | 11.3 | 11.5 | 10.4 |
| Civil servants | 2.0 | 5.2 | 11.7 | 16.0 | 9.6 | 10.1 |
| Sick / Disabled | 1.1 | 1.1 | 2.2 | 4.5 | 6.9 | 3.1 |
| Unemployed / Pre-retired | 14.1 | 9.5 | 7.5 | 9.8 | 23.6 | 11.6 |
| Others | 0.0 | 14.7 | 15.8 | 20.6 | 31.5 | 17.9 |
| Population (×1000) % of total population | 439.0 | 1,392.9 | 1,580 | 1,399.5 | 881.0 | 5,692.5 |
| 7.7 | 24.5 | 27.8 | 24.6 | 15.5 | 100.0 | |
-
Note: sample weights used.
4. Stylized reform scenarios
The previously discussed severe data limitations regarding civil servants’ careers influence not only the remainder of the paper. For lack of information, we can only apply reform scenarios to the schemes for wage-earners and self-employed – with the civil servant scheme remaining unreformed. All results of the simulations thus have to be interpreted against this backdrop. Reforms thus directly change the landscape for the two reformed systems, with any impact on the civil-servant scheme purely coming from the (indirect) interactions of entitlements and benefit levels across schemes – particularly for people with mixed careers or couples with earnings histories in different regimes.9
We propose a total of 5 stylized reform scenarios to illustrate the impact of various reforms of the Belgian retirement landscape. The first reform changes the current situation by eliminating the higher “household” replacement rate of 75% and aligning it on the “single” replacement rate of 60% for both wage-earners and self-employed (Reform 1 – no spousal benefits).
In the second scenario, we simulate a change to the various minima that have progressively been built into the Belgian pension landscape. One distinct advantage of micro-simulation based on the very detailed individual career data is that we can simulate both an increase and a decrease of generosity of the system, while more rudimentary information structures usually limit researchers to study the instantaneous impact of increases in generosity.10 Reform 2 takes an extreme position in the sense that it eliminates the two types of minima in the pension system, namely minima in pensionable earnings and minima in payable pension benefits. More specifically, we rule out the possibility for a worker to be granted the social insurance minimum pension, which requires the worker to have a career of at least 2/3 of the full career.11 The monetary amount of this minimum pension is system-dependent. We also eliminate the minimum that is applied under some conditions to the yearly gross pensionable remuneration. Though the latter minimum is theoretically also applicable to the other scheme, our simulation will focus on wage-earners because of lack of information.12 (Reform 2 – no minima)
The third scenario addresses the politically sensitive issue of imputed earnings for periods spent on replacement income receipt that is of particular relevance for the wage earner scheme, but also for the self-employed scheme. The aim of this reform is to document the impact of a reform to the system of this de facto imputation of earnings for periods of inactivity. To crystallize the effect, we focus on the wage-earner scheme and simulate the impact of a reduction of the wage taken into account for these periods to 0 percent of the last wage, as opposed to the 100 percent currently granted by the law. This means that while days on replacement income are still taken into account to determine eligibility criteria based on the number of insured days per year, or insured years per career, they are no longer taken into account for determining the career average earnings that form the basis of the pension calculation.13 (Reform 3 – no imputed earnings)
Reform 4 explores the interactions between the two key parameters of the pension system. We consider the combined effect of the Reforms 2 and 3 being applied simultaneously – to illustrate the cross-effects of reforms. (Reform 4 – interaction effects)
The final reform scenario we propose is the most profound one. The idea underlying this scenario is that the Belgian way of protecting people against bad life outcomes by means of imputed earnings and minima is only one possible approach among many. The design of this reform is inspired by the system applicable in the U.S. Social Security scheme.14 Our design proposes two main components of reform. First, the rules on minimum pensionable earnings by year of work are removed while the minimum pensions are maintained. De facto, this means that only the wage earners will be affected by the change. Second, all assimilated days are neutralized in the computation of the average career wage, i.e. earnings are no longer imputed for periods on social benefit receipt. Finally, pension benefits are computed on the best 35 years of career and the required length for a full career is also reduced to 35 years instead of the currently applicable 42 to 45 years. By shortening the period, negative life events are buffered differently than at present as low or no earnings years drop out to a larger extent.15 Thus the pension formula for Reform 5 reduces to
Simulated annual pension = N/35 * k * average wage of the best 35 years of career
where N is the number of years of career (limited to 35) of the claimant and k is a replacement rate, which takes on the value of 0.6 and 0.75 depending on whether the social security recipient claims benefits as a single or as a household. (Reform 5 – career length)
The five reform scenarios were chosen to document two broad ideas. On the one hand, Reforms 1–4 were chosen to document the impact of parametric reforms that would render the system more strongly contributions based with benefits depending more directly on effective past earnings and contributions. On the other hand, reform 5 was chosen to illustrate that the objective of protecting people with shorter careers can also be achieved by different means from the ones currently used in the Belgian retirement systems (e.g., minimum benefits and imputed earnings). Though parametric by nature, Reform 5 could at the same time be seen as a more fundamental reform of the system.
Of our reform scenarios, Reform 3 resembles most closely one specific aspect of the recent Di Rupo reforms. The government’s reform changes the way some periods of social benefit receipt enter into the pension formula – affecting mostly the long-term unemployed, long-term career breaks and some early retirees below the age of 60. Instead of crediting these periods at the last effective wage earned before becoming inactive, they will in the future only be valued at the level of the (less generous) minimum pensionable earnings. The government’s reform thus has two effects: a smaller incentive to remain/become inactive and a stronger decrease in generosity for higher income earners as compared to lower income earners as the minimum benefits remain unaffected.
Our reforms are significantly stronger than the government’s proposal and thus more revealing of the remaining scope for reform. Reform 3 illustrates the distributional effects with more acuity as the cuts in generosity are in the same direction but of significantly bigger amplitude than the government’s policies. Reform 4 illustrates the interaction effects between two measures both aimed at protecting people with incomplete and low earnings profiles. All of our reforms can hence be seen as a benchmark of what effects are maximally possible with parametric reforms. Table 2 provides a summary of the 5 proposed scenarios.
Key characteristics of reforms.
| Reform 1 | No spousal benefits | Elimination of the more generous “married couple” replacement rates |
| Reform 2 | No minima | Elimination of minimum pensions and of minimum earnings by year of work |
| Reform 3 | No imputed earnings | Imputed wages for periods of inactivity valued at 0 (assimilated days) |
| Reform 4 | Interaction effects | Reforms 2 and 3 together |
| Reform 5 | Career length | Elimination of minimum earnings by year. No imputed earnings. Pension benefits computed on the best 35 years of career. Full career: 35 years. |
5. Results
We compute the accrued to date (ATD) pension for each individual in our dataset both for the baseline and the various reform scenarios. The ATD pension is defined as the amount of an individual’s annual pension entitlements given her earnings to-date and supposing that the system is shut down and no future earnings added to the earnings record.16 To determine entitlements, we assume that all individuals will become eligible for pension benefits at the normal retirement age that is applicable to them according to the current law (i.e. 65). We exclude the possibility of anticipated retirement, which would require considering additional eligibility criteria. The benefit calculation program, PENSCALC, was written in FORTRAN programming language using a heavily parameterized architecture to allow simulations of a rich set of reform scenarios.
Our estimations of pension entitlements and simulations of reforms reveal a series of interesting results. We structure these results in three steps. First, we describe how ATD pensions in 2001 differ across the various ages and labor market statuses of individual. In a second step, we go beyond this inter-generational aspect by looking at the overall distributional consequences of reforms. Finally, we discuss the fiscal consequences of reforms.
5.1 Inter-generational aspect
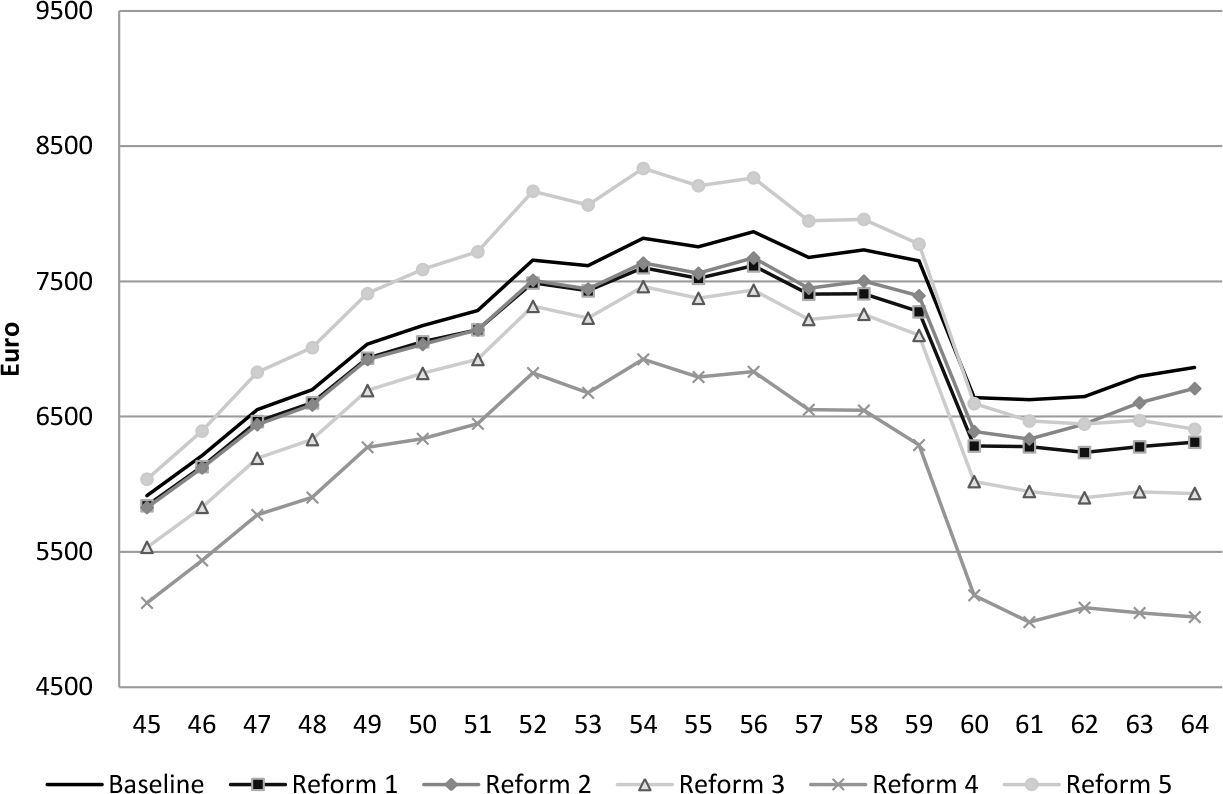
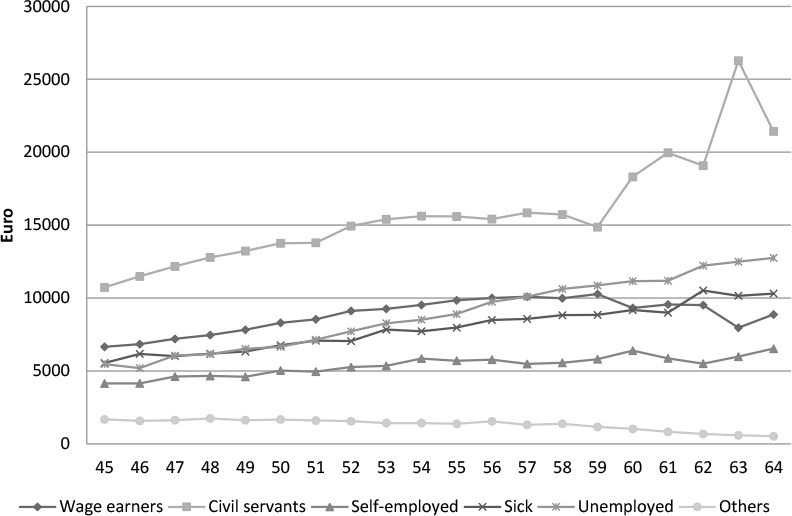
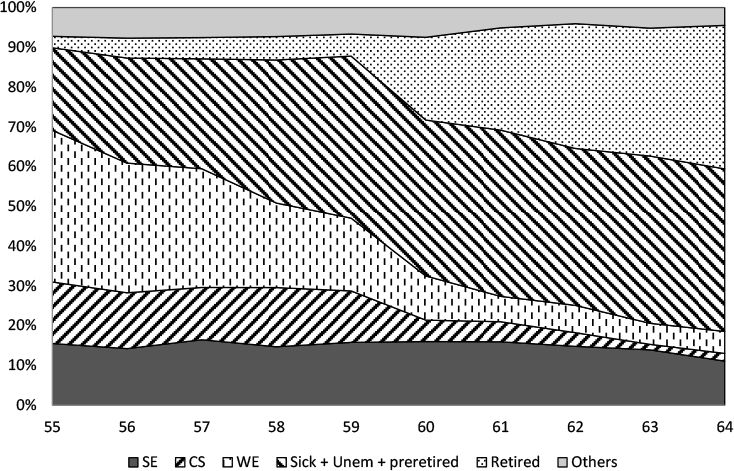
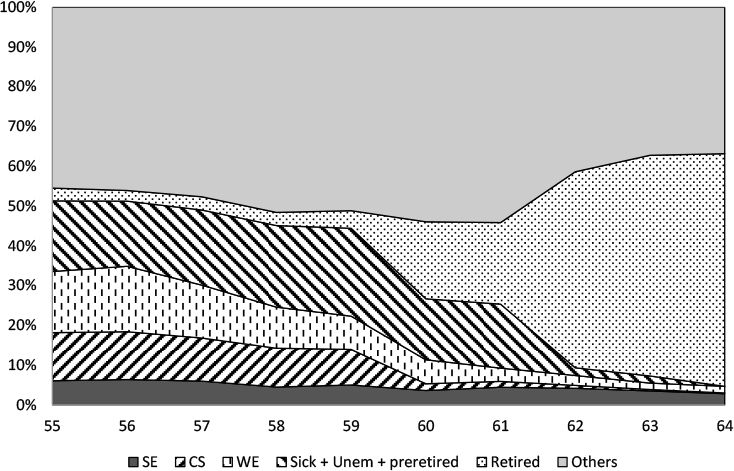
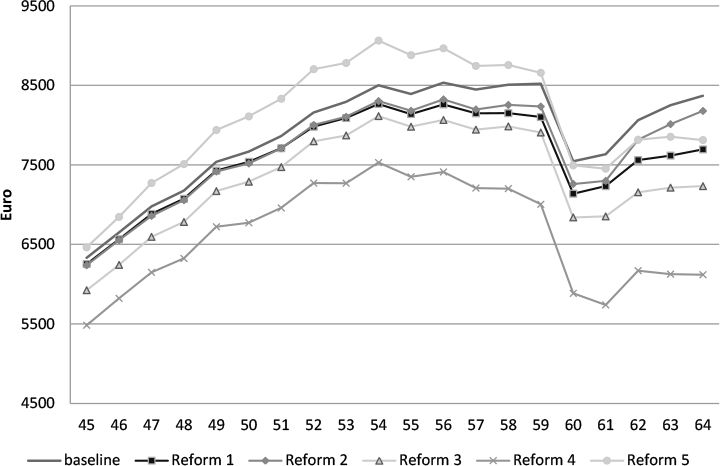
Figure 1 plots the average ATD pension for (nondependent and non-retired) individuals of the different age cohorts in our administrative data sample. This figure highlights two interesting findings. On the one hand, the age pattern of ATD pensions is not linearly increasing in age – neither for the baseline nor for any of the reform scenarios. While the observed drop at age 60 might surprise at first – given the general earnings and thus career and age-dependency of entitlements – there is a perfectly rational explanation. To help understand, two extra figures are useful. Figure 2 plots the Baseline ATD pension profiles for different categories of nonretired people as described in Table 1. It shows that ATD pensions for self-employed and “others” are (substantially) lower than for other categories. Figure 2 also shows that within most labor market categories, the age-ATD pension profile is less spectacular, with no strong drop at age 60. Figures 3a and 3b complement the picture as they summarize the share of the total population by its labor market status, for men and women respectively.

Average ATD pension by age cohort – sample (2001 EUR).

Average ATD pension by status: baseline scenario – sample (2001 EUR).

Population structure – Men ages 55–64 (2001).
Note: sample weights used.

Population structure – Women ages 55–64 (2001).
Note: sample weights used.
Figures 2 and 3 combined clearly document that the drop in the aggregate ATD pensions at age 60 occurs because the cohorts have a substantially different decomposition in terms of their activity status. A disproportionately larger departure into retirement by wage-earners and civil servants at 60 leads to an overall larger weight of low-ATD pension groups.
Figure 1 also reveals a second pattern, namely that reforms do not affect the inter-cohort distribution of ATD pensions in a linear way, with one reform even leading to lower entitlements for older cohorts and higher entitlements for younger cohorts.
Figure 4 plots the same statistic as Figure 1, but this time limited to the sample of people with strictly positive ATD pensions. While the general pattern is unchanged as compared to the complete sample, the age profile is somewhat affected by the fact that having a calculated ATD of 0 is not a uniform process across ages. People have no entitlements because they have not worked at all and not accrued any other rights to pensions, and hence their influence on average statistics in the overall sample depends heavily on their relative weight in each age cohort as compared to those that have positive entitlements.
Average ATD pension by age cohort (ATD>0) – sample (2001 EUR).
Considering the impact of the various reforms, several patterns are noteworthy. The “interaction effects” Reform 4 – that is a combination of Reforms 2 and 3 – has the strongest effect on pension rights. The reason is that the combined elimination of wage imputation and of minimum benefits jointly operates to substantially reduce entitlements. This might be somewhat surprising at first sight, but less so when considering the details of the system.
In fact, the simple parametric Reforms 1–3 illustrate that isolated targeted reforms have rather moderate effects because they only affect a very limited subset of people and the effect of reforms is partially buffered by other provisions of the pension systems. For example, the “spousal benefit” Reform 1 is buffered by the fact that two-earner couples are only partially affected by the reform insofar as the second earner has a substantially lower benefit than the first earner. Similarly, minimum benefits and imputed wages are two somewhat competing ways of protecting people with incomplete careers and thus limit each other’s impact, as illustrated by Reforms 2 and 3.
Reforms 1–4 display a pattern of losses of ATD that are increasing with age in absolute terms – at least up to age 60 where the above-mentioned recomposition effects become dominant. This finding is rather intuitive given that increased age is correlated with an increased likelihood of having benefited from these favorable replacement income schemes. This relation is strongest for Reforms 1 and 2, where the loss as a percentage of total ATD pensions is even strictly increasing with age in the same range.
The career-length Reform 5 introduces the biggest change to the system. Intuitively, the shorter required career length plays in favor of all cohorts – but particularly the younger ones. Indeed, given a constant number of working years, individuals are mechanically closer to achieving full benefits after the reform than before. While this basic trend also holds true for older cohorts, a second (and opposing) factor ends up at first offsetting and then dominating the first one as age increases. The reason is that as people approach the normal retirement age, more and more of them will have spent or will be spending time on social insurance programs before reaching the normal pension age. Average pension entitlements will thus decrease with age as a consequence of Reform 5 as these periods (on e.g. unemployment and early retirement programs) are no longer included in the earnings record. The distributional impact, however, is rather large as there are substantial number of winners and losers, and also substantial magnitudes to losses and gains to the system.
5.2 Distributional aspect
We now turn to the second step of our analysis, namely distributional results from the reform simulations. Table 3 presents the fraction of losers and winners in the population 45–64, the average gain and loss as well as the biggest gain and biggest loss. The results show that reforms do not only differ substantially in terms of their average effect, but also have wildly different distributional consequences in terms of the share of the population affected, as well as the distribution of gains and losses in the population. Similar (unreported) results can be derived for the overall population of all ages, in which case the basic pattern is maintained: the number of losers is largest for Reforms 3 and 4, while the average loss is the biggest for Reforms 4 and 5.
Distribution of gains and losses of annual ATD pensions: Ages 45–64 – sample (2001 EUR).
| Reform 1 | Reform 2 | Reform 3 | Reform 4 | Reform 5 | |
|---|---|---|---|---|---|
| % of losers | 11.9 | 28.0 | 65.2 | 70.3 | 24.9 |
| % of neutrals | 88.1 | 71.5 | 32.4 | 27.4 | 13.8 |
| % of winners | 0.0 | 0.5 | 2.4 | 2.2 | 61.3 |
| mean loss (k EUR) | −1,620 | −573 | −665 | −1,406 | −1,348 |
| mean gain (k EUR) | 0 | 587 | 271 | 505 | 992 |
| biggest loss (k EUR) | −4,386 | −6,620 | −8,538 | −13,727 | −10,472 |
| biggest gain(k EUR) | 0 | 2,478 | 2,078 | 2,903 | 7,956 |
| Gini coefficients | Baseline = 0.441 | ||||
| 0.439 | 0.454 | 0.453 | 0.502 | 0.465 | |
The Gini coefficients associated with the different scenarios are reported at the bottom of Table 3. Compared to the Baseline, Reform 1 has a moderate and mitigating effect on ATD inequality indicating that household pension supplements play a regressive role. In line with expectations, Reforms 2, 3 and 5 increase inequality somewhat, while Reform 4 has the strongest effect through the joint elimination of these two safeguarding mechanisms.
Table 4 reveals that women and men are affected differently by the various reforms. For example, the Reform 1 clearly targets one-earner couples. As men are traditionally the single earners in such households, the percentage of losers and the distribution of losses follow logically. Reform 2 (no minima) has the opposite tendency and affects women more strongly than men, both in terms of the percentage of losers and the absolute loss. It means that women (with sufficiently long careers) are more likely than men to benefit from these top-up mechanisms because of their lower earnings levels. Reform 3 (no imputed earnings) and 4 illustrate the current system’s bias towards men, as they disproportionately benefit from early retirement possibilities and thus are the major beneficiaries of the imputed earnings regime. Finally, Table 4 documents that a more fundamental transformation like in Reform 5 (career length) can have positive consequences for women as compared to men. The results are less gender-biased with women and men having similar profiles of losses while women have substantially bigger average gains than men. Figures 5a and 5b confirm these observations as baseline ATD pensions vary substantially according to the sex, and the various reforms affect both sexes in very different way.

Average ATD pension rights: Men ages 45–64 – sample (2001 EUR).

Average ATD pension rights: Women ages 45–64 – sample (2001 EUR).
Distribution of gains and losses of annual ATD pensions by sex: Ages 45–64 – sample (2001 EUR).
| Reform 1 | Reform 2 | Reform 3 | Reform 4 | Reform 5 | |
|---|---|---|---|---|---|
| Men | |||||
| % of losers | 22.1 | 23.7 | 67.8 | 71.7 | 22.2 |
| % of neutrals | 77.9 | 75.4 | 28.0 | 24.0 | 11.9 |
| % of winners | 0.0 | 0.9 | 4.3 | 4.3 | 66.0 |
| mean loss (k EUR) | −1,658 | −458 | −853 | −1,499 | −1,368 |
| mean gain (k EUR) | 0 | 587 | 289 | 506 | 992 |
| Women | |||||
| % of losers | 0.9 | 32.6 | 62.6 | 68.9 | 27.8 |
| % of neutrals | 99.1 | 67.4 | 37.1 | 31.1 | 15.8 |
| % of winners | 0.0 | 0.0 | 0.3 | 0.01 | 56.4 |
| mean loss (k EUR) | −658 | −662 | −448 | −1,302 | −1,330 |
| mean gain (k EUR) | 0 | 0 | 24 | 55 | 1,330 |
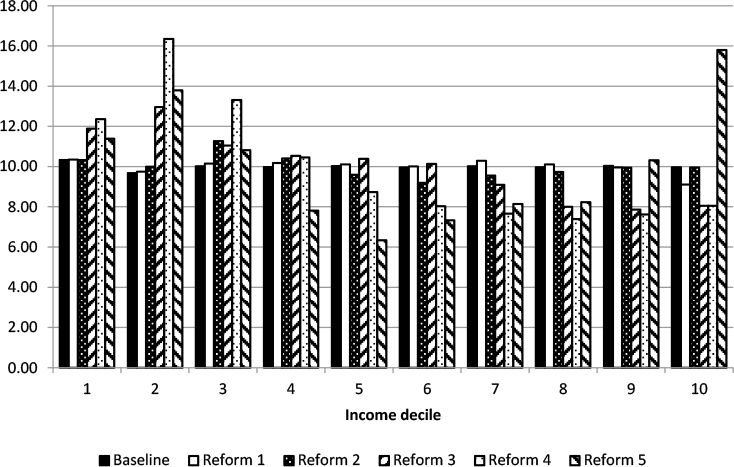
Another way of representing the distributional consequences of the reforms is to position individuals according to income deciles.17 Figures 6a and 6b show how the various reforms affect the population of Belgium and Flanders when looking at their position as compared to the baseline income deciles. The figures show that the bottom decile is only marginally affected, with the predominant part of the action happening through a downward shift of a mass of people from the middle and upper income deciles of the baseline scenario down to lower levels. Figures 6a and 6b illustrate that Reform 2 mostly affects the middle of the distribution, with low and high groups largely unaffected because of either insufficient careers or substantially larger entitlements. Reform 3 on the other hand, affects people of all income levels, thus also higher income individuals – with the ensuing substantial shift down the income deciles of a more substantial mass of the population.

Distribution of individuals according to the ATD pension rights, Baseline deciles – Population Belgium 2001.
Notes: Sample weights used; the first decile is larger than 10 percent of the population because of the number of people with ATD = 0.

Distribution of individuals according to the ATD pension rights, Baseline deciles – Population Flanders 2001.
Notes: Sample weights used; the first decile is larger than 10 percent of the population because of the number of people with ATD = 0.
The first four reform scenarios lead to a generally lower pension right and thus a downward movement of individuals of all income levels. The career-length Reform 5 has a more heterogeneous impact. People with higher incomes would be the major gainers of this reform as both their numbers and their average pension level increase. The reason is that they disproportionately benefit from the shorter averaging period and career length requirement of Reform 5: their wage profiles are generally steeper and careers usually shorter than those of lower income people, hence the result. At the other end of the spectrum, lower income people would have lower pensions because the imputed earnings for periods on social insurance would no longer be recognized in the same generous way. Both trends combine to make the system overall substantially less progressive.
A comparison between Figures 6a and 6b also gives a regional perspective to this distributional analysis. Reforms 2–4 have a substantially stronger effect on low income earners in Belgium than in Flanders, notably because of lower incomes and employment in Wallonia, while Reform 5 benefits Flemish high income earners most for the same reasons.18
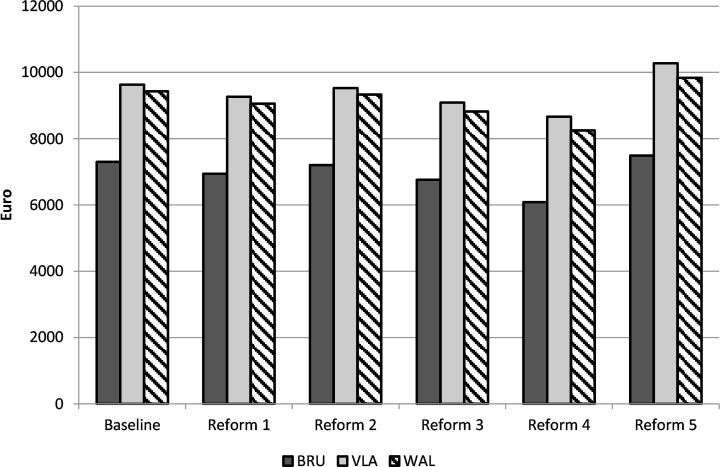
These regional differences at the decile level also hold up at the more aggregate level. Figure 7 shows the impact of the various reforms on the average ATD pensions for the population aged 45 to 64. Overall, differences in ATD pensions between Flanders and Belgium as a whole are somewhat smoother in aggregate than when broken down by decile.19 The same holds true when comparing Figure 7 to Figures 5a and 5b – which shows that the fluctuations for males and females separately are stronger than for the population as a whole.
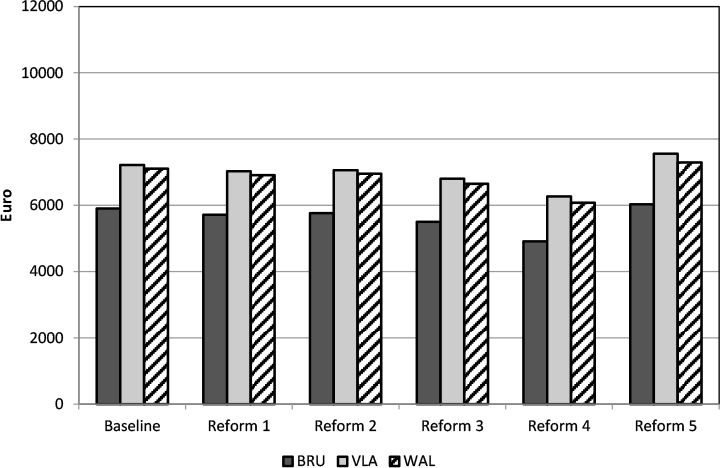

Average ATD pension rights by region – sample (45–64 years old – 2001 EUR).
5.3 Fiscal aspect
Last but not least, it is useful to consider the fiscal impact of the proposed reform scenarios. We calculate the present discounted value of ATD pension rights in the country using a two-step procedure. In a first step, we calculate for each individual the present discounted value of ATD pension entitlements over the entire remaining lifetime. In a second step, we aggregate all these individual amounts for the entire population to derive an aggregate fiscal indicator that puts an absolute Euro figure on the intertemporal cost of the current system. In our calculations, we assume that pension annuities are paid starting at the age of 65 and apply a 3% real annual discount rate as well as gender and regions-specific life tables.
The present discounted value of ATD pensions belongs to the larger family of indicators of “Social Security Wealth” or “pension wealth”, i.e. indicators that give the present discounted value of future pension benefits. The notion of pension wealth was first formalized by Feldstein (1974). Different definitions of pension wealth have emerged over time, varying amongst other in the way they treat past contributions, benefit accrual in the future and future (endogenous) benefit adjustments. Holzmann (2001) provides a useful overview of different pension wealth concepts. Past examples of such calculations are Perelman (1981) and Bouillot and Perelman (1995) for Belgium, Vernière (1992) for France, Van den Noord and Herd (1993) for seven OECD countries and Holzmann and al. (2001) for some low and middle income countries.
Figure 8 documents the present discounted value of pension rights expressed as a percentage of national GDP. The idea is to relate entitlements to an indicator of economic activity – to better put them into perspective. In this metric, Reforms 1, 2 and 5 have a moderate fiscal effect compared with the baseline. All stay within a 5% range of the baseline shutdown cost of approximately 116% of GDP or approximately 300 Billion EUR. This means that even though Reform 5 had the strongest distributional consequences, its overall fiscal cost is moderate. Reform 4 is the most promising in budgetary terms, with a substantial cut of 48.7 Billion EUR, or 18.75% of GDP.
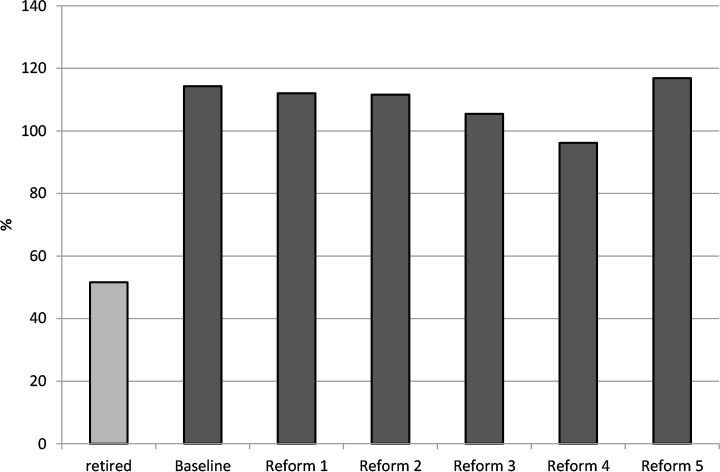
Present discounted value of pension rights as % of national GDP – Belgium, 2001 (black – non pensioners, grey – current pensioners).
Note: sample weights used.
Casting these costs against the backdrop of GDP is thus a particularly useful exercise to put the challenges and outcomes into perspective. Yet another way to put these indicators into perspective is to compare the ATD pension rights of the population of the non-retired, which are the focus of our analysis, to that of those already retired. The first bar of Figure 8 reflects the fiscal cost of future pensions owed to current retirees. It illustrates that the largest part of the fiscal cost of Belgian pension system does not relate to current pensioners, but rather to the population that is still active on the labor market.
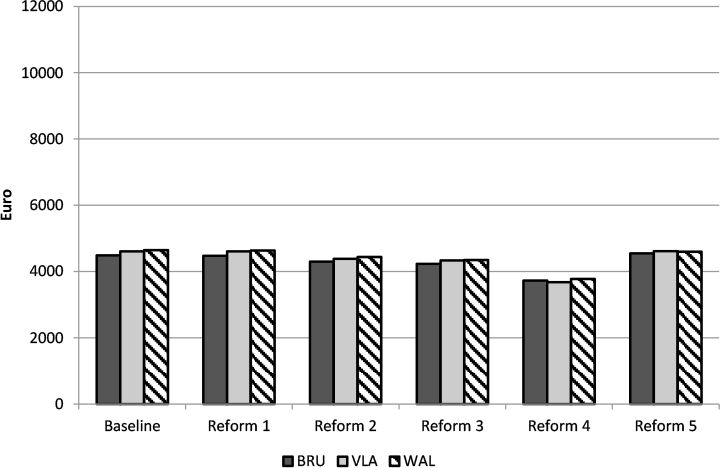
Figure 9 decomposes the total burden of the pension system by region to give an idea of the fiscal consequences of a de-federalization of the system. It reveals that Flanders is associated with the largest individual share of the pension burden. Somewhat surprisingly, when expressing the cost as a share of the total pension burden in the country, all regions bear a burden that is roughly in line with their population structure.
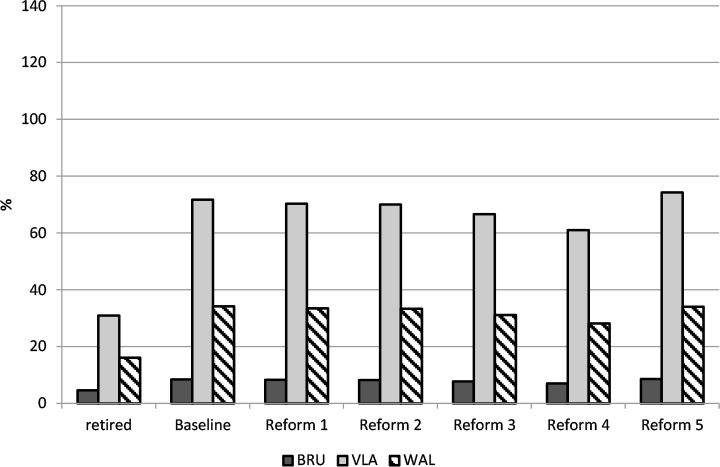

Present discounted value of pension rights as % of national GDP (18–64 years old, pensioners excluded) – Regional decomposition, 2001.
Note: sample weights used.
Regional differences do however matter when relating these regional burdens to regional GDP’s rather than the national one. The main advantage of this approach is that regional GDP represents an indicator of each regions’s ability to generate the resources needed to finance its own pension system, if it were to be split. The main disadvantage of relating pension expenditures to this indicator is that pensions (and GDP) is generally workplace related, whereas ATD pensions are allocated on a residence principle to individuals and thus to regions – purely because of lack of information on the place of work. Dury et al. (2008) already noted the importance of the choice of a residence versus a workplace allocation across regions. Figure 10 summarizes the result of this regional analysis. Brussels disporportionately benefits from such a comparison because of the combined effect of a large inward commuting workforce combined with its role as headquarters of larger companies – with Wallonia substantially lagging behind the other two regions mostly because of lower regional GDP.
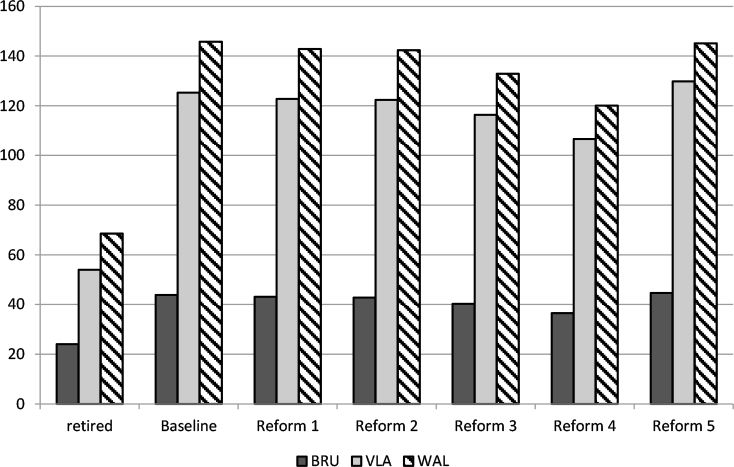

Present discounted value of pension rights as % of regional GDP(18–64 years old, pensioners excluded) – Regional decomposition, 2001.
Note: sample weights uses.
6. Conclusions
In this paper we report the results of accrued to date (ATD) pension estimations for the non-retired Belgian population aged less than 65 years old. Using a large administrative data file containing detailed information on professional careers, we were able to compute both individual-level pension rights and aggregate system indicators. Starting from the current-law baseline situation, we simulated five potential parametric reforms in pension rules.
Our results indicate that only deep reforms, i.e. near structural or cumulative parametric changes, have strong effects on pension entitlements. Some frequently discussed reforms such as a change in the rules regarding the accrual of pension rights by means of imputed wages or even changes to the minimum pensions have little effect when introduced individually. Though this finding might surprise at first, it is simply the result of the largely complex interplay of the numerous parameters in the pension formulas of any individual pension system, but also the effects across pension systems. As such, the effects of partial and targeted parametric reforms are likely to be buffered by other correlated variables that also enter the pension computation formula. Our analysis shows that a comprehensive approach involving several parametric changes is likely to generate the largest effects, both at the individual level and the aggregate fiscal level. Specificities heavily depend on the policy choices, with some reforms more heavily affecting the fiscal side, while others have a significantly stronger effect in terms of distribution. Our results also suggest that the recently passed government measures on imputed incomes for periods of inactivity – which are significantly less drastic than ours – will likely have very limited effects, both in budgetary and distributional terms. Our results show that one explanation for this finding is that individual measures are less effective than comprehensive ones given the numerous interactions and overlaps in entitlement rules and benefit formulas.
A second set of results relates to the regional dimension within the country. Our simulations reveal that the pension system itself has very little effects on the regional distribution – as the split of the ATD pensions across regions roughly corresponds to each region’s population share. Large differences in regional GDP could however lead to very different burdens between Flanders, Wallonia and Brussels if the system were shut down and the costs would have to be borne by the three regions individually.
Footnotes
1.
In a nutshell, the government’s reform reduces the generosity of civil-servant pensions by lengthening the reference period for pension calculation. For wage-earners, the key changes are later access to early retirement programs and a change in the pension formula affecting periods spent on social insurance benefits. A more complete review can be found on http://www.onprvp.fgov.be/FR/profes/news/Pa ges/reform2012.aspx.
2.
In addition, there is a means-tested minimum pension regime that we do not consider in the present analysis.
3.
Strictly speaking, the replacement rate for married couples of 75 % is applicable to one-earner married couples. In the presence of a married couple with two earnings records, any own pension entitlement of the spouse with the lowest pension entitlement will be credited against the household supplement calculated on the other’s record.
4.
Given a lack of information on the applicable numerator, we use a benefit accrual factor of 60 for all civil servants and a retirement age of 65 – a priori leading to an underestimation of pension entitlements.
5.
For example, it includes quarterly data on unemployment insurance, occupational disease, industrial accident, sickness and invalidity as well as pensions. http://www.ksz-bcss.fgov.be/fr/bcss/nodepage/content/websites/belgium/statistics/statistics_02.html
6.
The MIMOSIS project was financed by the Belgian Science Policy Administration (BELSPO Agora Program AG/01/086 and AG/01/116). The sample was randomly selected from the National Register at 1st January 2002 but the administrative information corresponds mainly to year 2001. For a detailed presentation of the MIMOSIS project, see Decoster et al. (2008).
7.
For wage earners, the underlying data comes from the institution CIMIRe (“Comptes Individuels Multisectoriels/ Multisectoriele Individuele Rekening”). For self-employed, the relevant institution is RSVZ-INASTI (“Rijksinstituut voor de Sociale Verzekeringen der Zelfstandigen/Institut National d’Assurances Sociales pour Travailleurs Indépendants”).
8.
The CAPELO project is currently being implemented to address this issue by creating a historical earnings record for civil servants. (http://www.capelo.be/). Notice that while in theory the panel nature of the Datawarehouse (and individual tax records) could be used to reconstruct the earnings history, this option was not available to us.
9.
This limitation is not specific to our approach, but rather a general problem for reform simulations in Belgium, as researchers have so far not had access to any centralized detailed dataset regarding civil-servants.
10.
Increases in generosity can be modeled as gap-filling transfers. Decreases in generosity require detailed information on the counterfactual pension, which in turn requires detailed information on careers.
11.
In the present context, the word career means either periods of work or periods spent on various forms of replacement income, such as unemployment insurance, etc.
12.
As a result, our reform simulation might be biased, with the bias likely small given the strong link between the minimum pension and the minimum pensionable earnings.
13.
To reflect the situation that vacation periods are qualified as replacement income for blue collar workers, as opposed to white collar workers, we correct for this by allowing a maximum of 20 non-contributory days at the full imputation rate of 100 % for blue-collar workers.
14.
For a summary of the US benefit rules, see http://www.ssa.gov/oact/COLA/Benefits.html.
15.
In practice, these changes lead to a considerable simplification of pension calculations. Instead of detailed accounting of work and inactivity days with the corresponding realized and imputed earnings, the system of Reform 5 relies on realized annual earnings as the key parameter entering the pension formula.
16.
For example, in the wage earner scheme, a single 50 year-old man with 25 working years would have ATD pension entitlements of (25*average wage*0.6)/45.
17.
ATD deciles are drawn within each 5-year age cohort of the baseline case, e.g. 55–59 years old. Decile cutoffs are kept constant across scenarios.
18.
For reasons of brevity, we focus the regional discussion on Flanders as the single largest region of the country.
19.
The result is robust to the choice of the age range, e.g. 18–64.
References
-
1
Evaluation patrimoniale des droits à la pension en BelgiqueRevue Belge de Sécurité Sociale pp. 801–831.
-
2
Final Report Project AG/01/116Final Report Project AG/01/116, http://www.socialsecurity.fgov.be/docs/nl/publica ties/mimosis/MIMOSISDescribe.pdf, [accessed 23 May 2012].
-
3
Interregional transfers and solidarity mechanisms via the government budgetNBB Economic Review pp. 93–112.
-
4
On the economics and scope of implicit pension debt: An international perspectiveEmpirica 28:97–129.
-
5
Evaluation patrimoniale des droits a la pension en BelgiqueCahiers Economiques de Bruxelles 89:25–52.
-
6
Une évaluation de l’équivalent patrimonial des droits à la retraite détenus par les ménagesEconomie et Prévision, n° 105:87–93.
-
7
Pension liabilities in the seven major economies, Economic Department Working Papers, OECD1–64, Pension liabilities in the seven major economies, Economic Department Working Papers, OECD, N°142.
Article and author information
Author details
Acknowledgements
The authors wish to thank Guy van Camp from the Federal Public Service Social Security for very helpful comments and for granting access to the pension calculator PENSCALC. Helpful comments were provided by 2 anonymous referees and the editor of the journal. Financial support from the IWT contract Flemosi is gratefully acknowledged. All errors are our own.
Publication history
- Version of Record published: December 31, 2012 (version 1)
Copyright
© 2012, Jousten et al.
This article is distributed under the terms of the Creative Commons Attribution License, which permits unrestricted use and redistribution provided that the original author and source are credited.