LifeLossMOD: A microsimulation model of the economic impacts of premature mortality in Australia
- NHMRC Clinical Trials Centre, University of Sydney, Australia
Abstract
While the direct costs of mortality to the health care system are known to be significant, there is less information regarding the wider economic impacts of mortality including the implications for productivity, household incomes and government revenue. This paper outlines the development of LifeLossMOD, a new microsimulation model to estimate the economic impacts of premature mortality in Australia. The model is based on a census of 2003 mortality records and applies projections from the APPSIM microsimulation model to estimate the counterfactual lifetime trajectories forgone to the year 2030. We estimated that mortality in 2003 accounted for over 280,000 full time working years lost to the Australian economy. Future applications of LifeLossMOD will explore the distributional impacts of mortality on employment, GDP, government revenue and household income, wealth and retirement savings. These estimates will allow decision makers and others to more accurately determine the full economic impacts of mortality by cause. In addition, the model will be able to quantify the financial gains likely to accrue with preventative health care interventions, which can in turn be reported on in cost effectiveness analyses.
1. Introduction
Premature mortality, defined as mortality occurring before the projected life expectancy, accounts for approximately 49% of the burden of disease in Australia (Begg, Vos et al. 2007). Several studies have demonstrated that the direct, health system costs of mortality are significant (Mendelson & Schwartz 1993; Scitovsky 1994; Mathers, Penm et al. 1998; Seshamani & Gray 2005; Neuberg 2009; Rosenwax, McNamara et al. 2011). However, there is relatively little information on the economic impacts of premature mortality that occur outside the health system, including the impacts on productivity and government revenue. This is despite studies finding that the productivity related costs of disease can far outweigh the direct health care costs, in some cases accounting for over 80% of the total costs of illness (Max, Rice et al. 2003; Max, Sung et al. 2009).
Recent studies have demonstrated that an approach which considers the interaction between health and labour force participation may be highly effective in increasing economic productivity and government revenue. Schofield et al have applied microsimulation methods to demonstrate the large economic loss associated with the illness-related early retirement of older working age Australians (Schofield, Passey et al. 2009; Schofield, Shrestha et al. 2011) and the potential for health care interventions to increase labour force participation, government revenues and GDP (Passey, Shrestha et al. 2012). However, there have been no studies examining the relationship between all-cause mortality and key economic indicators in Australia. While a few have estimated the economic costs of mortality for specific diseases, these analyses were based on aggregated datasets and the scope was limited to the productivity related costs alone (Taylor, Pezzullo et al. 2006; Collins & Lapsley 2008; Deloitte Access Economics 2011).
This paper outlines the development of LifeLossMOD, a new microsimulation model to fill the gap in the evidence surrounding the economic impacts of premature mortality in Australia including the impacts on employment, productivity, income, government revenue and household wealth and retirement savings. We also present the results of a preliminary analysis to determine the total number of working years lost due to mortality. The results of LifeLossMOD will allow decision makers and others to determine the economic impacts of premature mortality, as well as the financial gains that would accrue with interventions able to prevent particular conditions, and thus mortality due to that condition. While the model is applicable to an Australian context, we believe that the policy issues addressed, and the approach taken, will be of benefit to those facing similar concerns in other developed economies.
2. Previous literature
Historically, the economic costs of mortality have been estimated by applying average earnings to the period of production lost due to premature death. This has its basis in the cost of illness (COI) methodology developed by Rice in 1966 (Rice 1966). Calculation of mortality costs generally considers earnings over a lifetime rather than a single year since, if an individual had not died, they would have continued to be productive for a number of years according to their life expectancy.
However, the estimation of productivity losses by applying average wage rates to aggregate mortality datasets has several key limitations. Such estimates are generally determined by assuming that all persons included in the study would have, without illness, achieved average earnings and paid an average amount of tax for the remainder of their working age lives (Deloitte Access Economics 2005). This generalisation does not take into account evidence that both income and type of illness differ by age, sex, education and occupation. For example, a higher degree is related to 100% higher earnings in later working life (Johnson & Lloyd 2000). In addition, when projections are based on occupations and salary levels at a single point in time, there is no allowance for trends in salary growth, and labour force participation.
We are not aware of any studies that have applied microsimulation methods to estimate the economic impacts of mortality. The use of aggregate datasets has not allowed distributional analysis and has restricted previous studies to estimating the productivity impacts of mortality alone, with no attempts made to measure the more specific impacts on labour force participation, household wealth or government revenue streams.
3. Methods
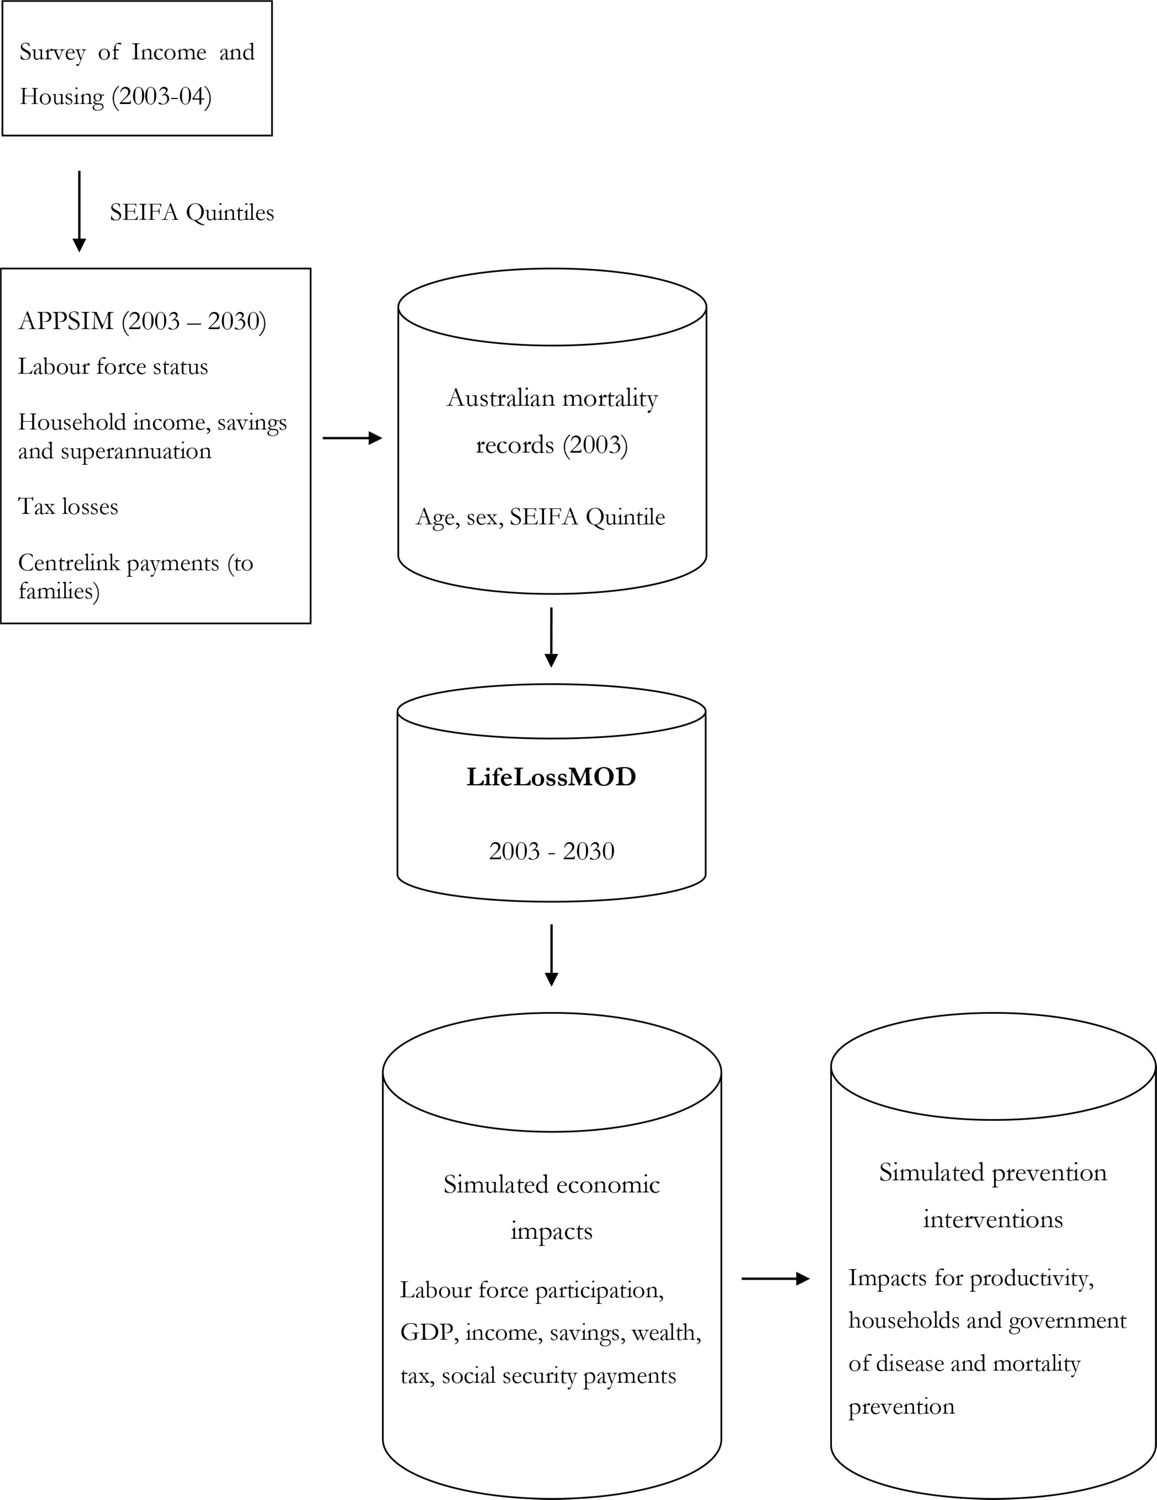
There were two main component datasets used to create LifeLossMOD: the base population and the APPSIM microsimulation model. Figure 1 provides a schematic diagram of how these components relate to each other and provide the modelled outputs. SAS was used as the main language for the modelling and related statistical analyses.
3.1 Base population
The base population was developed using Australian mortality data for 2003. These data were obtained from the 2003 Australian Burden of Disease Study (Begg, Vos et al. 2007), and were originally compiled by the Australian Bureau of Statistics using 2001 mortality data collected from the state Registries of Births, Deaths and Marriages(Australian Bureau of Statistics 2001)1. The burden of disease study applied projected disease trends to the 2001 deaths in order to reflect the likely distribution of deaths by cause in 2003. A total of 131,495 mortality records were extracted from the adjusted dataset, of which 68,704 were classified as occurring prematurely (that is, before the age of 80); these records formed the base population of LifeLossMOD. Each mortality record contained variables describing the cause of death as well as the individual’s age, sex and SEIFA quintile. SEIFA is a metric developed by the Australian Bureau of Statistics (ABS) that summarises a range of information about the economic and social conditions of people and households within a given geographic area. It then ranks areas in Australia according to relative socio-economic advantage and disadvantage (Trewin 2003). For generalisability, the cause of death was mapped from the original ICD-10 coding to the global burden of disease codes. Table 1 provides a breakdown of the total number of deaths in the base population cohort by age and sex.
The advantage of this dataset was that it provided near complete population coverage (with less than 1% underrepresentation of actual 2003 deaths (Australian Bureau of Statistics 2001)), allowing us to be confident that we were capturing an accurate distribution of all deaths that occurred in 2003. The major drawback was its limited nature in terms of the key outcomes we wished to model, including labour force participation, income and wealth. In order to overcome this limitation, it was necessary to impute estimates of relevant variables onto the mortality records. This was achieved using data from the APPSIM model.
3.2 APPSIM
APPSIM is a dynamic microsimulation model of the Australian population that was developed by the National Centre for Social and Economic Modelling (NATSEM) with the aim of evaluating the impact of future fiscal and social policies (Kelly 2007). It was designed to be broad in scope and answer a range of policy questions including the likely future distributional consequences of changes in social security and taxation programs and the likely future retirement incomes of the baby boomers.
The APPSIM model uses a one percent sample of the 2001 Australian Census (consisting of 188,000 individuals) as its base population. It has a modular structure in which its primary functions are broken down into several key groupings. For example, the demographic module models births, deaths and migration. The household formation and movement module models couple formation and separation and children leaving home. This creates a dynamic dataset of individuals, households and their relationships to one another, upon which projections of education, labour force participation, income, expenditure, asset accumulation, social security payments, taxation and superannuation can be based (Keegan 2009). The projections from APPSIM are derived using demographic data and projections from the Australian Bureau of Statistics (ABS) (Pennec & Bacon 2007), as well as datasets from large Australian surveys including the Household, Income and Labour Dynamics in Australia (HILDA)(Wooden, Freidin et al. 2002) and the Longitudinal Study of Immigrants to Australia (Cobb-Clark 2001). These data sources were used to generate transition probabilities for events within the model, which were then applied to every person in the initial APPSIM population to annually update the population’s characteristics up to the year 2030.
The labour force module within APPSIM is one of the most critical in terms of populating counterfactual outcomes in LifeLossMOD. This module is applied after APPSIM has calculated demographics, family formation and educational participation, and its purpose is to enable the prediction of an individual’s labour force status based on certain characteristics. Labour force status was classified within the model as full-time (35+ hours per week), part-time (less than 35 hours per week), unemployed and not in the labour force. The estimation of the equations used in the labour force module was based on data from the HILDA survey using a total of 39,087 observations.
The model applied a series of multinomial logit regressions to estimate the probability that a person was in a given labour force state. The explanatory variables within these equations were: highest level of education achieved, marital status, age of youngest child, health and labour force status for the previous two years. The output of the multinomial logit model was a series of four probabilities per observation that represent the likelihood that the person would be full-time, part-time, unemployed or not in the labour force as at June 30 each year. A Monte Carlo process was then used to allocate labour force states to individuals within the model accordingly.
Once labour force states were allocated, two binomial logit equations (one for each sex) determined the probability a person was self-employed in that year, as opposed to an employee. Hours worked per week were then calculated using hours worked in the previous year(s). Those who were not in the labour force the previous year had their hours allocated from a sex-specific probability distribution. For those who were in the labour force the previous year, a binomial logit equation determined whether their hours changed or stayed the same as the previous year. Those whose hours were determined to change were allocated a random number of hours, with a mean of 0 and a standard deviation of 6, which was added to the previous year’s hours to determine their new hours worked.
3.3 Building LifeLossMOD
In order to estimate additional socio-demographic characteristics for individuals in the base population, an individual record in APPSIM was randomly chosen to represent a counterfactual life trajectory for each record in the base population with similar socio-demographic characteristics. The additional income and wealth related characteristics of the APPSIM individuals were adopted as the expected characteristics of the individual in the base population (assuming a counterfactual scenario where the death did not occur). The primary reason for matching the mortality dataset to APPSIM, as opposed to merely applying mortality risks to APPSIM records, was to account for the socio-economic factors that influence both the type of illness an individual may experience, as well as the likelihood of death. The SEIFA variable in the mortality dataset was able to provide this information on an individual level, which once matched to records in APPSIM was able to greatly enhance the variability in the model.
The limited nature of the mortality dataset meant that the only variables available to be used in the matching process were an individual’s age, sex and SEIFA quintile. While the APPSIM model contained detailed information on income, education and wealth, it did not provide an explicit SEIFA index (or the level of geographical information needed to assign this variable). Due to the enhanced matching power that a SEIFA variable would be able to provide in terms of accurately assigning labour force and income data to the mortality dataset, we first imputed SEIFA indexes onto the APPSIM records. This was achieved using SEIFA distributions from the unit record file dataset of the 2003–04 Survey of Income and Housing (SIH) (Trewin 2006).
3.3.1 Imputing SEIFA onto the APPSIM dataset
The SIH contained individual level information on a variety of socio-economic characteristics, including the SEIFA quintile. The variables in common between APPSIM and the SIH that were most consistent with the final outcomes we wished to model were identified, these being the household income quintile, household wealth quintile and individual labour force status. For every combination of these variables, the proportion of SIH records falling in to each SEIFA quintile was calculated. A Monte Carlo process was then used to assign a SEIFA quintile to each APPSIM record based on these underlying distributions. The reason why a Monte Carlo process was used in this instance, rather than simply allocating the most likely SEIFA quintile to an individual with a given combination of characteristics, was due to the inherent variability within the SEIFA index itself. As SEIFA is an area-based index, individuals across the full spectrum of socio-economic characteristics may appear within each quintile. The Monte Carlo process was able to allow for some less likely SEIFA allocations occur, as is consistent with how this index is allocated in practice.
3.3.2 Matching individual mortality records with individual APPSIM records
The mortality records were then linked to similar records in APPSIM using a counterfactual approach. This process consisted of two main steps. Firstly, individual records in both the 2003 mortality dataset and the 2003 APPSIM population were grouped into homogenous cells, or ‘bins’, based on their combination of five year age category, sex and SEIFA quintile. Approximately 0.9% of mortality records were excluded due to a missing SEIFA variable. In the second step, each mortality record within a particular bin was linked with an individual from the APPSIM dataset that appeared in the same bin. As the APPSIM dataset contained records across all possible bins, the matching process was able to be performed with 100% accuracy such that distributions of income and employment variables by age, sex and SEIFA quintile were identical within both APPSIM and LifeLossMOD. Where there were multiple APPSIM records in the same bin as an individual mortality record, matching was performed randomly with replacement, consistent with the ‘unconstrained matching’ approach described by Rassler (Rässler 2002). Under this process, the same record in APPSIM could be synthetically matched with multiple mortality records. To allow for the effects of uncertainty in the linking of records, the matching process was performed on each of the 100 APPSIM datasets described above, to create 100 uniquely matched datasets, henceforth referred to as LifeLossMOD.
3.4 Benchmarking
Due to the matching process described above, all records in LifeLossMOD contained identical age, sex and SEIFA variables as those in the original mortality dataset. A benchmark analysis was performed in order to test the distributional accuracy of the records contained in LifeLossMOD against additional variables obtained from aggregated 2003 mortality data (Commonwealth of Australia 2003). Age linked data was available for an additional three variables: marital status, state of usual residence and country of birth. We compared the proportion of premature deaths in each of these categories to the corresponding proportions in the base year of LifeLossMOD (Table 2). The results of this analysis suggested that the matching process performed well in terms of linking mortality records to similar individuals in APPSIM. In particular, the distribution of records across the states and territories of Australia was near perfect. Distributions across marital status and country of birth variables were also highly correlated, with a maximum overall percentage difference of 7% between individual categories.
3.5 Applications of the model
The key applications of the model are based on the underlying premise of counterfactual analysis, also referred to as the ‘potential outcomes framework’. Counter-factual analysis provides an approach to measuring the causal impact of an event by conceptualizing the outcomes that would have been observed had the event not occurred (Morgan & Winship 2007). The framework has its origins in the statistics and economics literature, and now forms the basis of causal inference measurement in medical and epidemiological studies (Hofler 2005). For example, the causal impact of a medical treatment is generally estimated by comparing the results for a group of patients who received treatment to the results for an identical group in the absence of treatment. The ‘counterfactual’ refers to the set of potential outcomes that might have resulted had this treatment group not received the treatment (but instead experienced an alternative course of action, e.g. no treatment, other treatment, etc).
Counterfactual causality was the central idea that stimulated the invention of randomised experiments by Ronald A. Fisher and statistical inference on them by Fisher around 1920 (Holland 1986). Later, Rubin applied the counterfactual model to statistical inference in observational studies (Rubin 1974). It is this approach which underpins the potential applications of LifeLossMOD. Projections from the matched APPSIM records out to 2030 are used to determine the counterfactual lifetime trajectories forgone due to premature mortality in 2003. The resulting outcomes can be used to estimate the potential economic gains forgone. In effect, these results are likely to underestimate the full extent of the impacts as only 66% of the matched records that were of working age (or younger) in 2003 had reached the counterfactual retirement age of 65 by 2030.
The first application of the model has been to estimate the total number of full time equivalent (FTE) working years (defined as 40 hours per week, 48 weeks per year) lost due to premature mortality in 2003. We adopted a human capital approach, whereby the economic impacts of mortality are assumed to be equal to the sum of the expected lifetime outcomes that would have been realized had the disease or death been avoided. This theory values the costs by their opportunity cost: that is, the value of the best alternative use of these resources. This is the traditional method for valuing production losses (Rice 1966) and it remains the dominant approach in recent COI literature (Bradley, Yabroff et al. 2008 ; Ortiz-Ortiz, Pérez-Irizarry et al. 2010; Cadilhac, Magnus et al. 2011; Hanly, Soerjomataram et al. 2014).
The FTE analysis was applied to all individuals participating in the labour force at any point between 2003 and 2030, regardless of age. Our results present the mean of the 100 simulations performed on the 100 bootstrapped mortality datasets (Table 3). We found that the total number of working years forgone between 2003 and 2030 was approximately 280,308. This estimate was highly robust to the effects of uncertainty, with a 95% confidence interval of 278,151 to 282,547 representing a range of less than 2% around the mean. Male deaths accounted for around three quarters of the working years lost. The number of FTE working years forgone was relatively evenly distributed between the first three SEIFA quintiles (21 – 22%), with a slight taper seen in quintiles four (19%) and five (16%).
3.6 Future applications of the model
3.6.1 Modelling the economic impacts of mortality
Having imputed the necessary variables onto the mortality records, it is possible to estimate the impact of premature mortality on national gross domestic product (GDP). GDP will be calculated using the income approach (also referred to as GDP(I)) as specified in the official ABS formula (Australian Bureau of Statistics 2013):
In addition to calculating the overall productivity impacts of mortality, the model will be able to determine the impacts from the perspectives of the both the government and individual households. The government perspective will incorporate impacts on tax revenues and transfer payments, while the household perspective will account for the effects on household income, wealth and superannuation balances. The model will also be able to identify the diseases responsible for the greatest economic impact.
3.6.2 Modelling the impact of evidence based reductions in premature mortality
The model will simulate the impact of effective disease prevention interventions in order to identify the extent to which specific interventions may be able to reduce the economic impacts of mortality. These interventions will initially be selected from the NHRMC ACE-Prevention study, which has modelled the cost effectiveness of more than 100 interventions addressing the prevention of non-communicable diseases including mental disorders, cancer and obesity (Vos, Carter et al. 2010). Results from this study were reported in terms of a reduction in the years of life lost for each age, sex and disease. This data will be imputed onto the simulated mortality records in order to provide a distributionally accurate estimate of the long term economic benefits associated with specific health care interventions.
4. Discussion
The model presented here was developed to determine the economic impacts associated with all-cause mortality in Australia. It allows for the estimation of the long term impacts of mortality on labour force participation, GDP, income, government revenue and household assets. Our initial analyses suggest that these impacts are likely to be substantial, with mortality in 2003 resulting in a loss over 280,000 full time equivalent working years to 2030. These years were distributed relatively evenly across SEIFA quintiles, with the lowest proportion of years recorded in the highest quintile. Combined with data on disease trends and the effects of evidence based health care interventions, these analyses will provide valuable information to researchers and decision makers in allocating priorities for future medical research and treatments.
Recent work by Schofield et al has applied microsimulation techniques to determine the economic impacts of illness in older Australians (Schofield, Passey et al. 2009). This methodology was able to overcome many of the limitations associated with previous attempts to value the productivity costs of illness. The study found that approximately 650,000 persons aged 45–64 were lost from the labour force due to ill health annually, resulting in a loss of $12-$14 billion in GDP per annum (Schofield, Shrestha et al. 2008). However, the model was developed specifically to assess the impact of morbidity and thus did not capture the impacts of mortality. LifeLossMOD is able to fill this current gap in the evidence.
The strength of the microsimulation approach presented here lies is its ability to impute key variables of interest onto an individual level mortality dataset, using reliable data sources and statistically robust techniques. It was therefore possible to significantly enrich the data available for analysis. The advantage of this approach over the use of aggregated datasets is that, because individual level data is being used, the variation and complexity in the analysis can be significantly increased.
Another significant advantage of the microsimulation approach we have employed is that our analyses of the economic impacts of mortality are not limited to estimating productivity losses alone, but can also provide detailed information on labour force outcomes in general, as well as impacts on government revenues and household income, savings and asset accumulation.
The model is limited by the predictive ability of the covariates used to link the base population to the APPSIM microsimulation model, those being age, sex and SEIFA index. It is further limited by the accuracy of the SEIFA index that was initially imputed onto the APPSIM dataset. We have attempted to address both of these uncertainties by assigning 100 SEIFA values to each APPSIM record based on distributions from the Survey of Income and Housing, creating 100 unique APPSIM datasets. We then bootstrapped the synthetic matching process of the mortality dataset to each of the 100 APPSIM datasets. Our results present the mean of these 100 bootstraps for each outcome reported on, along with the 95% confidence intervals. The relatively narrow confidence intervals presented here indicate that our results are robust to the effects of uncertainty in the imputation and matching process. In addition, a benchmark analysis revealed that the distribution of LifeLossMOD records among marital status, state of usual residence and country of birth were highly correlated with those reported in official mortality data from 2003.
The results of this model are likely to have implications for government policy in Australia. Labour force policies in Australia have historically been developed in a context of high unemployment and have accordingly focused on job creation. However, recent structural changes in the Australian economy, including the emergence of skills shortages in key industries and the impact of the ageing population in reducing the relative size of the tax base, have meant that labour shortages are a growing policy concern. In response to the changing labour market environment and its wider implications for the economy, one of the key priority areas of Australian government policy over the last decade has been to increase the productive capacity of the workforce. The landmark Intergenerational Reports (IGRs) of 2002 and 2007(Australian Treasury 2002; Australian Treasury 2007), as well as the Productivity Commission’s report on the Economic Impacts of Ageing in 2005(Productivity Commission 2005), and recent government budget announcement(Swan 2011; Swan 2012) have all identified the emerging labour shortages as our population ages as a major challenge for Australia. Despite this focus, the potential for effective health care interventions to increase the size of the productive workforce has been largely overlooked.
In addition to generating data on the impacts of hypothetical reductions in mortality, the model will be able to estimate the long term economic benefits associated with evidence based health care interventions. These results will demonstrate the opportunity for researchers in the health care field to present a wider view of the costs and benefits associated with new health interventions. It will provide information on the potentially synergistic effects available from health care funding in terms of improving both health and economic outcomes. This has implications for decision makers when taking a cross-portfolio approach in the allocation of scarce resources.
Future health economics research should focus on accounting for the full economic impacts of improved health. A recent review by Krol et al found that most cost effectiveness studies of health care interventions ignored productivity costs entirely (Krol, Papenburg et al. 2011). For those studies that did account for lost productivity, these costs represented an average of 60% of the total costs per treatment arm. The authors concluded that the inclusion of productivity costs significantly affected the incremental costs between treatments in a number of studies, and that studies which ignore these costs may poorly reflect the full societal costs (or savings) of an intervention. Further to this, the National Institute for Clinical Excellence in the UK (NICE) has recently announced that they will soon consider the societal benefit of pharmaceuticals, including their impact on productivity, in their assessment of treatments for reimbursement (Zhang & Anis 2014). The inclusion of this additional set of financial gains will enrich the information available to decision makers in allocating scarce resources between competing priorities and as such may provide valuable information to governments seeking to improve not only the health but also the productivity of the nation.
In conclusion, LifeLossMOD is Australia’s first microsimulation model of premature mortality and its impact on economic productivity, labour force participation, household income and government revenue and expenditure. It is able to fill substantial gaps in the evidence about the broad economic impacts of premature mortality and in turn the societal benefits of health care interventions.
LifeLossMOD.
Number of premature deaths in the 2003 mortality cohort by age and sex.
| Age Group | Male | Female | Total |
|---|---|---|---|
| < 15 | 954 | 738 | 1,692 |
| 15–24 | 1,028 | 370 | 1,398 |
| 25–34 | 1,455 | 591 | 2,046 |
| 35–44 | 2,259 | 1,246 | 3,505 |
| 45–54 | 4,012 | 2,454 | 6,466 |
| 55–64 | 7,549 | 4,468 | 12,062 |
| 64–80 | 25,027 | 16,508 | 41,535 |
| TOTAL | 42,329 | 26,375 | 68,704 |
Benchmark analyses (in %).
| Benchmark category | Proportion in aggregate Aust. mortality data | Proportion in LifeLossMOD * | Absolute difference in overall proportions |
|---|---|---|---|
| Marital status | |||
| Never married | 18 | 26 | 7 |
| Married | 52 | 50 | 2 |
| Widowed | 16 | 17 | 1 |
| Divorced | 11 | 7 | 3 |
| Not stated | 3 | - | - |
| State of usual residence | |||
| NSW | 35 | 36 | 1 |
| Vic | 24 | 25 | 0 |
| Qld | 18 | 18 | 0 |
| SA | 9 | 8 | 1 |
| WA | 9 | 9 | 0 |
| Tas | 3 | 2 | 1 |
| NT | 1 | 1 | 0 |
| ACT | 1 | 2 | 0 |
| Country of birth | |||
| Australia | 69 | 76 | 7 |
| Overseas | 31 | 24 | 7 |
-
*
Values represent the mean of 100 simulations.
Modelled estimates of working years lost between 2003 and 2030 due to all cause premature mortality in 2003.
| FTE working years lost by SEIFA quintile | ||||||
|---|---|---|---|---|---|---|
| Q1 | Q2 | Q3 | Q4 | Q5 | TOTAL | |
| Male 95% CI % of total male | ||||||
| 47,690 | 47,622 | 45,358 | 39,591 | 32,542 | 212,802 | |
| 46,713–48,816 | 46,759–48,630 | 44,287–46,288 | 38,771–40,456 | 31,620–33,379 | 210,693–214,826 | |
| 22% | 22% | 21% | 19% | 15% | 100% | |
| Female 95% CI % of total female | ||||||
| 14,199 | 14,947 | 14,221 | 12,732 | 11,408 | 67,506 | |
| 13,627–14,924 | 14,446–15,565 | 13,697–14,860 | 12,269–13,318 | 10,914–11,872 | 66,542–68,599 | |
| 21% | 22% | 21% | 19% | 17% | 100% | |
| Total 95% CI % of total cohort | ||||||
| 61,888 | 62,569 | 59,579 | 52,323 | 43,949 | 280,308 | |
| 60,577–63,294 | 61,452–63,686 | 58,186–60,858 | 51,468–53,307 | 42,906–44,897 | 278,151–282,547 | |
| 22% | 22% | 21% | 19% | 16% | 100% | |
Footnotes
1.
Data was obtained from the Burden of Disease study as the ABS was not releasing any current or historical unit record file mortality data at the time of model development.
References
- 1
-
2
Australian System of National Accounts: Concepts, Sources and MethodsCanberra: Commonwealth of Australia.
-
3
Intergenerational Report 2002–03, Budget paper no. 5Canberra: Commonwealth of Australia.
- 4
-
5
The Burden of Disease and Injury in Australia 2003The Burden of Disease and Injury in Australia 2003, Canberra, AIHW. PHE 82.
-
6
“Productivity Costs of Cancer Mortality in the United States: 2000 – 2020Journal of the National Cancer Institute 100:1763–1770.
- 7
-
8
Australian Economic Review467–477, The Longitudinal Survey of Immigrants to Australia, Australian Economic Review, 34, 4.
-
9
The costs of tobacco, alcohol and elicit drug abuse to Australian society in 2004/05Commonwealth of Australia.
-
10
Deaths, AustraliaDeaths, Australia, Canberra, Australian Bureau of Statistics, 3302.0.
-
11
The Economic Cost of Arthritis in New ZealandThe Economic Cost of Arthritis in New Zealand, Canberra.
-
12
Re-awakening Australia: The economic cost of sleep disorders in Australia, 2010Re-awakening Australia: The economic cost of sleep disorders in Australia, 2010.
-
13
Measuring the societal burden of cancer: The cost of lost productivity due to premature cancer-related mortality in EuropeInternational Journal of Cancer.
- 14
-
15
Statistics and causal inferenceJournal of the American Statistical Association 81:945–962.
- 16
-
17
Mandatory superannuation and self-sufficiency in retirement: An Application of the APPSIM Synamic Microsimulation Model2nd General International Microsimulation Association Conference.
-
18
APPSIM – Selection of the Main Source Data File for the Base DataCanberra: National Centre for Social and Economic Modelling, University of Canberra.
- 19
-
20
Health System Costs of Disease and Injury in Australia 1993–94, Australian Institute of Health and Welfare, CanberraHealth System Costs of Disease and Injury in Australia 1993–94, Australian Institute of Health and Welfare, Canberra.
-
21
The economic burden of gynecologic cancers in California, 1998Gynecologic Oncology 88:96–103.
-
22
The economic burden of breast cancer in CaliforniaBreast Cancer Research and Treatment 116:201–207.
-
23
Effects of ageing and population growth on health care costsHealth Affairs 12:119–125.
-
24
Counterfactuals and causal inference: methods and principles for social researchCounterfactuals and causal inference: methods and principles for social research.
-
25
The cost of end-of-life care: a new efficiency measure falls short of AHA/ACC standardsCirculation Cardiovascular Quality and Outcomes 2:127–133.
-
26
Productivity Loss in Puerto Rico’s Labor Market due to Cancer MortalityPuerto Rico Health Sciences Journal 29:241.
-
27
The impact of diabetes prevention on labour force participation and income of older Australians: an economic studyBMC Publich Health, 12, 1.
-
28
APPSIM – Modelling Fertility and Mortality in the APPSIM Dynamic Microsimulation Model. Working Paper No. 5National Centre for Social and Economic Modelling, University of Canberra.
-
29
Economic implications of an ageing Australia, CanberraEconomic implications of an ageing Australia, Canberra.
-
30
Statistical matching: A frequentist theory, practical applications, and alternative Bayesian approachesStatistical matching: A frequentist theory, practical applications, and alternative Bayesian approaches, New York.
-
31
Estimating the cost-of-illnessWashington, DC: US Department of Health, Education and Welfare, Public Health Service.
- 32
-
33
Estimating causal effects of treatments in randomised and nonrandomised studiesJournal of Educational Psychology 66:688–701.
-
34
Health&WealthMOD: A microsimulation model of the economic impacts of diseases on older workersInternational Journal of Microsimulation 2:58–63.
-
35
Modelling the cost of ill health in Health&WealthMOD (Version II): Lost labour force participation, income and taxation and the impact of disease preventionInternational Journal of Microsimulation 4:32–36.
-
36
Chronic disease and labour force participation among older AustraliansMedical Journal of Australia 189:447–450.
- 37
-
38
A longitudinal study of the effects of age and time to death on hospital costsJournal of Health Economics 23:217–235.
- 39
- 40
-
41
The economic impact and cost of visual impairment in AustraliaBritish Journal of Opthmology 90:272–275.
-
42
Socio-Economic Indexes For Areas: Information Paper. Australian Bureau of StatisticsCanberra: Commonwealth of Australia.
-
43
Household Expenditure Survey and Survey of Income and Housing 2003–04: Information PaperCanberra, Commonwealth of Australia: A. B. O. Statistics.
-
44
Assessing Cost-Effectiveness in Prevention: Final ReportMelbourne: University of Queensland, Brisbane and Deakin University.
-
45
Enhancing the Evidence Base for Economic and Social Policy in Australia: The Household, Income and Labour Dynamics in Australia (HILDA) SurveyMercer–Melbourne Institute Quarterly Bulletin of Economic Trends 3:17–20.
-
46
Health-Related Productivity Loss: NICE to Recognize Soon, Good to Discuss NowPharmacoeconomics 32:425–427.
Article and author information
Author details
Publication history
- Version of Record published: December 31, 2014 (version 1)
Copyright
© 2014, Carter
This article is distributed under the terms of the Creative Commons Attribution License, which permits unrestricted use and redistribution provided that the original author and source are credited.