Care&WorkMOD: An Australian microsimulation model projecting the economic impacts of early retirement in informal carers
-
Rupendra N Shrestha

-
Deborah Schofield
-
Melanie J B Zeppel
-
Michelle M Cunich
-
Robert Tanton
-
Simon J Kelly
-
Lennert Veerman
-
Megan E Passey
- Macquarie University, Australia
- The University of Sydney, Australia
- University of Canberra, Australia
- Griffith University, Australia
Abstract
We developed a microsimulation model, Care&WorkMOD, to estimate the economic costs of early exit from the labour force, both for informal carers and the government, from 2015 to 2030. In this paper, we describe the methods used to create the model Care&WorkMOD, and the sources of data and model assumptions. Care&WorkMOD is based on the unit record data of people aged 15–64 years in the three Australian Bureau of Statistics (ABS) Surveys of Disability, Ageing and Carers (SDAC) 2003, 2009 and 2012. Population and the labour force projections from the 2015 Intergenerational Report and the outputs of an Australian microsimulation model APPSIM were used for the static aging of the base data to every five years from 2015 to 2030. The 2015 output dataset of another microsimulation model STINMOD was linked with Care&WorkMOD base data using synthetic matching. The matching process has added data on further economic variables from STINMOD into Care&WorkMOD, which are not available in SDACs. Economic data were indexed based on long-term trends on economic variables to capture the projected economic growth from 2015 to 2030. Care&WorkMOD can provide the long-term estimates of the lost labour productivity due to informal caring responsibilities and the related economic burden both at the individual and national level, and has the potential to “fill the gaps” in the current body of evidence on the costs of chronic diseases, particularly related to informal carers.
1. Introduction
Informal carers provide care to others in need of support, and make a significant contribution to a nation’s productivity by replacing paid care of people with disability, mental illnesses, chronic conditions, and the frail aged (Nguyen & Connelly, 2014). Informal carers are important as they provide a service to the government that would otherwise need to be paid for by employed carers (Diminic et al., 2017). Similarly, informal carers allow for ‘ageing in place’, with the aged population remaining in their homes instead of moving to aged care facilities (Commonwealth Department of Health and Ageing, 2014). Government spending on ‘aged care’, which is separate to informal carers, was $16.2 billion in 2016 (Aged Care Financing Authority, 2017). The majority of informal carers are female (Nepal, Brown, Ranmuthugala, & Percival, 2011; Stacey, Gill, Price, Warmington, & Taylor, 2016), aged 25–64, and the burden of informal care often leads to reduced labour force participation (Access Economics, 2005; Deloitte Access Economics, 2015). Informal carers were estimated to be providing 1.9 billion hours of care in 2015, with each carer providing an average of 13 hours per week. The replacement cost of informal care in 2015 in Australia was estimated to be A$60.3 billion, equivalent to 3.8% of the gross domestic product and 60% of the health and social work industry (Deloitte Access Economics, 2015).
The Australian Government is seeking ways to enable workers to remain in the workforce longer, in order to fund health and other essential services needed by the ageing populations, and manage labour shortages. At the same time, the need for informal carers is increasingly taking on greater relevance as the burden of disease transitions from acute fatal diseases to long-term chronic diseases (Stacey et al., 2016). Indeed, it has been argued that if this care was not provided informally to people with mental illness, the Australian National and state/territory governments would need to spend A$13.2 billion to provide the same level of health and social services (Diminic et al., 2017). Many studies have shown that informal carers that have reduced work hours are more likely to leave the labour force and have lower incomes compared to non-carers (Bittman, Hill, & Thomson, 2007; Gray & Edwards, 2009; Adams, 2010). Therefore, the ability to project future numbers of informal carers and their labour force participation is important for national governments to provide long-term care and manage health care costs.
Microsimulation models are increasingly being used to estimate various aspects of health economics, including health expenditure, the cost-effectiveness of health interventions and programs, and the impact of various health conditions on the labour force (Brown & Harding, 2002; Dieleman et al., 2016; Doble, Schofield, Roscioli, & Mattick, 2016; Schofield, Shrestha & Cunich, 2016). A number of microsimulation models have been developed to estimate the demand for care (Percival & Kelly, 2004; Chin & Harding, 2006; Pickard, Wittenberg, Comas-Herrara, Kink, & Mallay, 2007; Lymer, Brown, Harding, & Yap, 2009; Nepal, Brown, Kelly, Percival, Anderson, & Hancock, 2011). An Australian study, based on the 1998 Australian Bureau of Statistics (ABS) Survey of Disability, Ageing and Carers (SDAC) and the 2001 Census data, produced small area estimates of disability levels and the need for aged care across age groups, in order to allow the execution of social policy and elderly care services for older Australians (Chin & Harding, 2006; Lymer et al., 2009). These studies reported that as age increases both the presence and severity of disability increase, indicating a higher requirement for care, and particular geographic areas had higher needs for provision of care (Lymer et al., 2009). Recent microsimulation studies have been used to quantify how much policies cost, rates of growth of costs, the distribution of expenditure, regional differences in health, and whether the health labour force will be sufficient to match the future needs for health care (Schofield, Shresta, Kelly et al., 2014). Microsimulation models are useful at a national level, by modelling the records of individuals from national surveys, with the ability to examine the effects of policy changes for well-defined ranges of individuals or demographic groups, as well as for national aggregates.
A microsimulation study projected the demand for informal carers of disabled people to 2031 in England (Pickard et al., 2007). The projections for informal carers to 2031, as well as other forecasts for the next ten years, show that the demand for informal carers is growing at a faster rate than the supply, meaning the ratio of carers “supply to demand” is likely to substantially decrease in future decades (Deloitte Access Economics, 2015). Reasons for this include couples having fewer children, increasing life expectancy, increasing geographic distance between parents and children, and a higher retirement age (Pickard et al., 2007), with trends reported to be similar in Australia (The Treasury, 2015a, 2015b). In Australia, the Australian Government’s commitment to caring for the elderly at home (‘ageing at home’), rather than in care (Commonwealth Department of Health and Ageing, 2014), is likely to increase the proportion of the population who are informal carers. Financial support through the National Disability Insurance Scheme (NDIS) may also influence the proportion of informal carers, however, it is too early to tell impacts of the NDIS on the number of carers. Similarly, microsimulation has shown that the substantial increase in years lived with disability (YLDs) over the past 20 years has also increased the demand for informal carers (Schofield, 2016). Although there have been several microsimulation models projecting the demand for carers, there have been none estimating the long-term economic impact of the provision of informal care on both carers themselves, as well as on the government.
In this paper we describe the methods, data sources and assumptions used in constructing a new microsimulation model, Care&WorkMOD, which has been developed to estimate the long-term economic costs of lost labour force participation of informal carers due to their caring responsibilities. Care&WorkMOD can model the economic costs and estimate economic impacts such as lost Productivity Life Years (PLYs) due to informal caring, lost personal incomes, lost taxation revenue, increase in welfare payments, lost gross domestic product (GDP) and economic hardship. The model is able to capture the long-term projections of
demographic changes;
changes labour force participation rates (for all genders, and across age groups);
real wage growth;
real growth in other economic variables such as the value of assets and savings;
number of informal carers.
2. Methods
Care&WorkMOD is a static microsimulation model designed to project socio-demographic and economic profiles of Australian informal carers aged 15–64 years every five years from 2015 to 2030. It uses static ageing methods to project population profiles. The model was written and run in SAS V9.4 software (SAS Institute, Cary, NC, USA). The output datasets of Care&WorkMOD include four datasets containing similar information on Australians aged 15–64 years, at different points in time (2015, 2020, 2025, and 2030). Each dataset contains individuals’ socio-demographic and economic information such as their carer status, labour force status, reason for not being in the labour force, earned income, government support payments, and wealth. The datasets also include information on their care recipients such as their age, gender, chronic health conditions, if they are primary carers, and if their main care recipient is living with them in the same household.
Care&WorkMOD has four main components: i) the base population — the microdata on which the model is built; ii) population and labour force projections from the 2015 Australian Intergenerational Report; iii) output datasets of the Australian Population and Policy Simulation Model (APPSIM); and iv) output datasets of Static Incomes Model (STINMOD). We assumed that these four component datasets were representative of the Australian population and can be linked. Figure 1 shows the schematic diagram of Care&WorkMOD and how each component and its linkage.

Structure of Care&WorkMOD.
2.1 Base Population (Surveys of Disability, Ageing and Carers)
Care&WorkMOD is based on the ABS Surveys of SDACs from 2003, 2009 and 2012 (Australian Bureau of Statistics, 2016). SDACs are regular Australian nationally representative, cross-sectional randomly selected household surveys collecting the most comprehensive information on Australians living with disabilities, older people and individuals providing care for people with a disability, and older people. The surveys collect information on all individuals living in randomly selected households regardless of whether or not they are in one of the above population groups. The SDACs are a rich data source for socio-demographic and economic information of Australians and contain detailed information about respondent’s health conditions (e.g. pain, neurodegenerative diseases, mental illness, heart disease, diabetes, childhood onset cognitive, and physical disability).
The SDACs have two samples: (i) household component samples which include individuals living in private dwellings and non-private dwellings such as hotels, motels, boarding houses and self- care components of retirement villages; and (ii) cared accommodation component samples which include individuals living in cared accommodation such as nursing homes and hospitals. The scope of Care&WorkMOD covers the Australian population aged 15–64 years old living in households and excludes those living in cared accommodation.
The base data files of Care&WorkMOD consists of confidentialised person level unit record data (CURF) of Australians aged 15–64 years old from the household component samples of three SDACs (2003, 2009 and 2012), which were concatenated to provide greater variability in the data. 24,014 unit records from the 2003 SDAC, 41,622 unit records from the 2009 SDAC, and 44,483 unit records from the 2012 SDAC of the Australians aged 15–64 years old were concatenated to create a base data file of Care&WorkMOD of 110,119 unit records. All three SDACs have applied similar sampling methods and the contents that are within the scope of Care&WorkMOD are comparable between all three surveys, making it possible to concatenate the three datasets after statically ageing the 2003, 2009 and 2012 data to the base year 2015 (see Section 2.6 for details about static ageing and reweighting used in Care&WorkMOD). Where there were any differences in the definition of categories for any variables between the three survey datasets, we merged two or more categories in order to make the categories consistent in all three datasets.
2.1.1 Identifying informal carers in the Survey of Disability Ageing and Carers (SDAC)
There are several definitions of carers in the SDACs. Informal carers were identified as those who indicated they were:
a primary carer of a usual resident (i.e. lives with) care recipient (care recipient identified and carer identified);
other primary carer of a usual care recipient;
primary carer of a non-usual resident (i.e. does not live with) care recipient; or
other carer.
However, information on both the main care recipient and carer (such as age, sex, education, labour force participation, chronic conditions, and duration of care) were only available for main usual resident care recipients who could be matched to primary carers. Additionally, information on the main disabling chronic condition of care recipients was only available for those who were living with their primary carers. For this reason, we defined only the primary carers who have care recipients living with them in the same household (i.e. categories (a) and (b)) as informal carers for Care&WorkMOD and all other carers (i.e. categories (c) and (d)) as other carers.
2.2 Population and labour force projections
To ensure that the model accounted for the growth in population and the trends in labour force participation, we statically aged the data using the population and labour force projections from the 2015 Australian Intergenerational Report (IGR) (The Treasury, 2015a), with the reweighting described in Section 2.6. We extracted population projections and projected full-time and part-time employment rates to 2030 for Australians aged 15 to 64 years by five-year age group and gender.
Care&WorkMOD covers only the Australians living in households and excludes those living in cared accommodation and correctional institutions whereas the 2015 IGR population projections are for the whole nation. For that reason, we estimated the proportions of individuals (by age and sex) living in households (excluding cared-accommodation and correctional institutions) both private and non-private dwellings using the Australian Census of Population and Housing data for 2011 (Australian Bureau of Statistics, 2011). These estimated proportions from the 2011 Australian Census for Population and Housing were then applied to the 2015 IGR population projections to estimate the projected number of individuals living in households and were used as benchmarks to align the projected population coverage of Care&WorkMOD. Model input data disaggregated by age and sex is shown in Figure 2.

Informal carers by age and sex (SDAC, 2012).
2.3 The Australian population and policy simulation model (APPSIM)
APPSIM is a dynamic population microsimulation model, which provides projections of socioeconomic characteristics of the Australian population annually (Keegan & Kelly, 2009). The model is maintained and developed by the National Centre for Social and Economic Modelling (NATSEM) at the University of Canberra. This model is based on a random sample of 1% of the 2001 Australian Census of Population and Housing data (about 188,000 records of individuals) and simulates the impact of social and fiscal policies on every Australian. As each simulated year passes, a range of events including birth, death, migration, divorce, labour force participation, and retiring are simulated in the model. The probability of each of these events occurring is based on probability tables or logistic regression equations from historical data. By simulating birth, death and migration, the model allows the simulated population to change and age over time. APPSIM outputs a simulated dataset representative of the socio-demographic and economic characteristics of the Australian population for each year to 2030. We extracted APPSIM output datasets for individuals aged 15–64 years in five-year intervals from 2015 to 2030.
2.4 Static incomes model (STINMOD)
STINMOD is a static microsimulation model of Australia’s income tax and transfer (welfare) system (Percival, Abello, & Vu, 2007). It plays an important role in conducting assessment of the distributional impacts of government’s tax and transfer policies, independent from the Commonwealth of Australia. The model was developed and is now regularly updated by NATSEM and was previously used by other Commonwealth departments. The model simulates the impact of Australian Government’s major reforms on cash transfers, income tax and the Medicare levy on individuals and families and identifies the winners and losers of the reforms. STINMOD is based on the ABS Surveys of Income and Housing data and covers Australians living in households excluding those living in cared accommodation, similar to the Care&WorkMOD base population. It is updated each year by incorporating recent changes to the Australian Government’s tax and transfer payment system announced in each year’s federal budget.
We extracted a STINMOD output dataset for 2015, which includes the relevant Australian Government social policies, rates of payment and eligibility criteria for that year. STINMOD uses income unit level unit record data from the ABS Survey of Income and Housing as a base data file and simulates changes in income, tax and welfare payments at income unit level. We expanded the unit record data at income unit level of STINMOD output dataset to person level unit record data to use in the Care&WorkMOD. The STINMOD output dataset has socio-demographic and economic information such as income, income tax paid, and transfer payments received assigned to individual persons. Savings and assets information are at the income unit level. We shared savings and assets of the income unit equally among the two oldest people in a couple family, and to the oldest person in a single parent family, and assigned them to person record data.
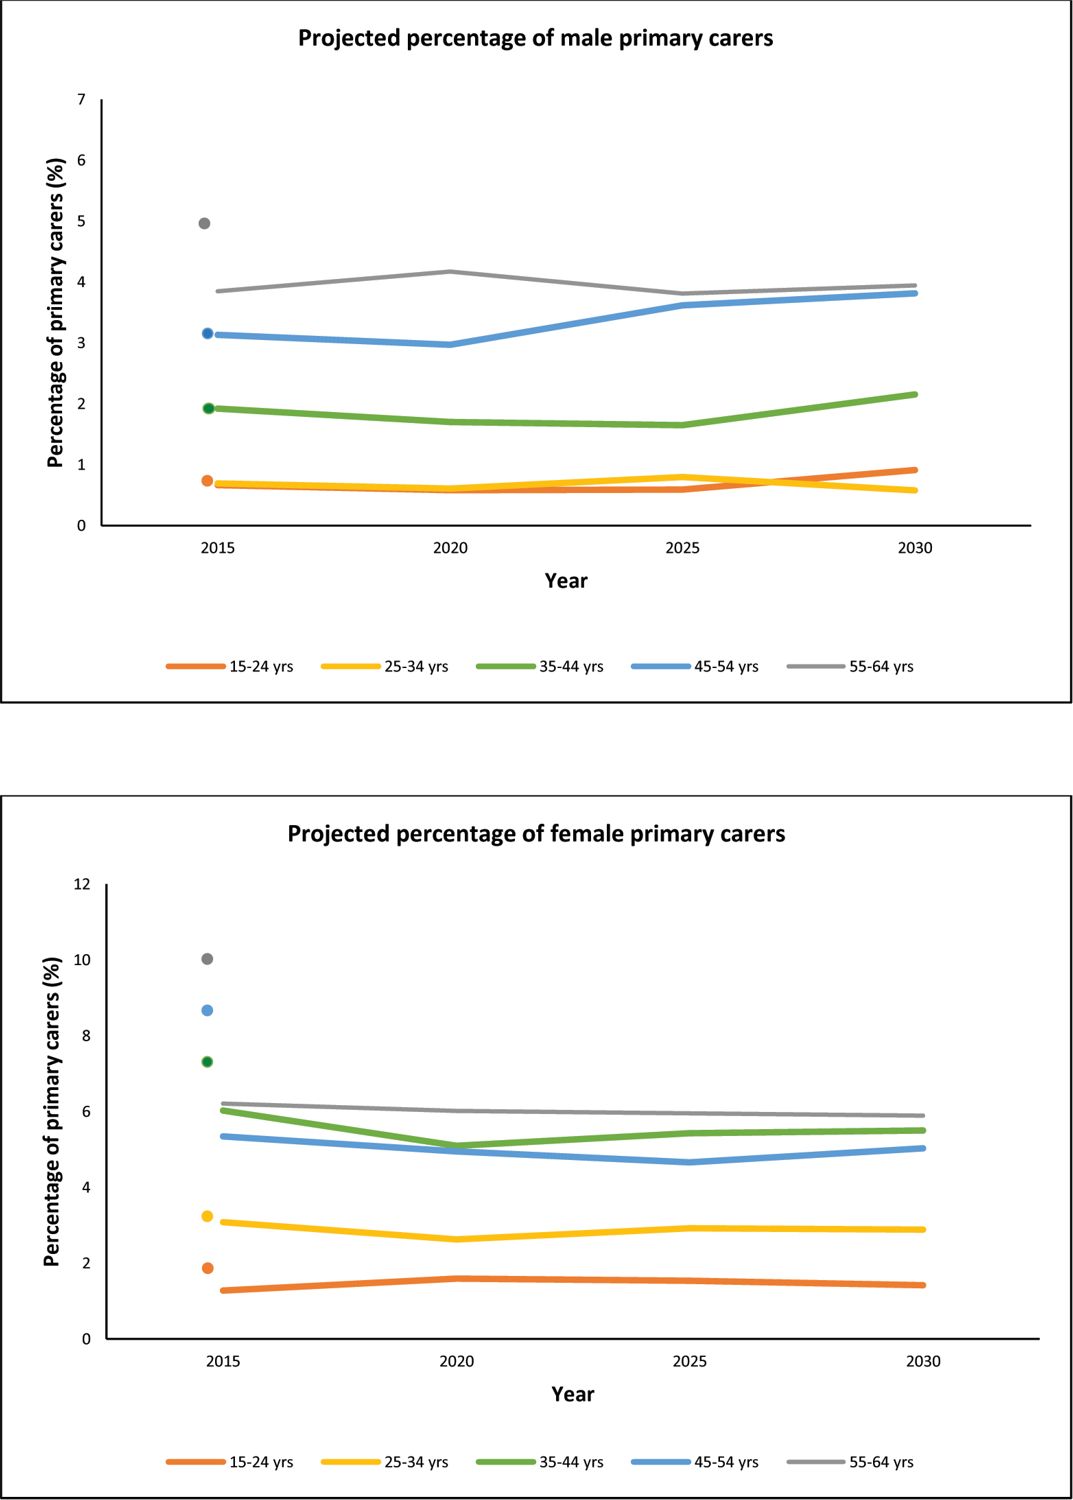
Projected percentages of primary informal carers among the total population by age group and sex, 2015–2030. Dots represent the SDAC estimates for 2015.
Note: For males 15–24 and 25–35 both values are 1%.
2.5 Projections of the number of informal carers
The number of informal carers by 10-year age group and gender were projected for 2015 to 2030 based on the proportion of primary carers in APPSIM output datasets. In APPSIM, whether or not an individual was a primary carer was modelled in two steps (Keegan & Kelly, 2009). First, a multivariate regression model based on socio-demographic information on individuals and their family members was used to estimate the probability an individual in APPSIM had carer duties and then whether or not that individual was a primary carer was modelled using a Monte Carlo simulation method. We estimated the age- and sex-specific rates of primary carers for the 2010 APPSIM output dataset. These rates were then compared with the estimated SDAC rates for 2010 based on a linear trend between SDAC 2009 and 2012 rates to estimate an alignment factor for APPSIM rates of primary carers to align with SDAC rates. The APPSIM age- and sex-specific rates of primary carers for 2015 to 2030 were calibrated with the alignment factor to re-estimate the projected age- and sex-specific rates of primary carers for 2015 to 2030 (Figure 3). These aligned rates were then applied to the 2015 IGR population projection to estimate the projected number of informal primary carers by 10-year age group and gender for every five years from 2015 to 2030.
Estimates of percentages of primary informal carers for 2015 for the SDAC by age group and gender are shown in Figure 3 to compare with projected data. This comparison shows that the proportion of male carers aged 15–24, 25–34 and 35–44 years and female carers aged 15–24 and 25- 34 years were comparable, while males carers aged 55–64 year and female carers aged 35–64 years were a higher proportion than in the actual SDAC 2015 data.
2.6 Reweighting
Care&WorkMOD output datasets provide snapshots of socio-demographic and economic characteristics for the Australian population aged 15–64 years for every five years from 2015 to 2030 (i.e. for 2015, 2020, 2025, 2030). The base datasets for Care&WorkMOD are based on 2003, 2009 and 2012 Australian populations. In Care&WorkMOD we used static ageing to capture changes in socio-demographic structure of the population (such as ageing, labour force participation, demand for informal carers) from the survey years 2003, 2009 and 2012 to Care&WorkMOD base year of 2015 (and other modelled years to 2030). The survey data are weighted by the ABS to address the issue of unequal probability of selection in the surveys, and to make the survey data as close as possible a representation of the Australian population in the year of survey (Australian Bureau of Statistics, 2016). Each record in the survey datasets has a survey weight assigned to take into account the individual’s probability of selection and the clustering and the stratification of the sample. The weighting reflects the number of people with comparable characteristics in the Australian population at the particular survey year. We reweighted the SDAC 2003, 2009 and 2012 to reflect the profile of the subsample aged 15–64 years in 2015 and other modelled years (2020, 2025, 2030), using an algorithm based on generalised regression reweighting techniques, coded in a SAS macro called GREGWT, developed by the ABS (Bell, 2000). It uses the generalised regression method to modify initial survey weights such that the new weighted totals match the externally provided totals known as benchmarks. The mathematical technique of GREGWT is described in detail in Singh and Mohl (1996) and Tanton, Vidyattama, Nepal, and McNamara (2011).
We used the projections from the 2015 IGR as benchmarks for population and labour force growth for Australians aged 15–64 years. In order to capture socio-economic changes, benchmark populations were created based on APPSIM output datasets for the corresponding years. Populations were derived by applying estimated distributions based on APPSIM output datasets to the 2015 IGR population projections. The following projected populations were used as benchmarks:
population by age group and gender;
number of individuals in full-time employment by age group and gender;
number of individuals in part-time employment by age group and gender;
number of individuals not in the labour force due to their chronic conditions by age group and gender;
number of individuals not in the labour force due to informal caring by age group and gender;
population by age group, gender and income quintiles;
population by age group, gender and highest level of education;
population by income unit type;
population by age group, gender and whether or not owns a home;
number of informal carers by age group and gender (as estimated in Section 2.5).
Three SDACs (2003, 2009 and 2012) were first separately reweighted to Care&WorkMOD base year 2015. Following synthetic matching with STINMOD (see below), the concatenated reweighted SDAC datasets to 2015 were then further reweighted to other modelled years (2020, 2025 and 2030) so that the weighted datasets reflect the projected population profile of Australians aged 15–64 years in 2020, 2025 and 2030.
2.7 Synthetic matching of Care&WorkMOD base population with STINMOD records
The SDAC data includes limited economic information. In order to generate estimates of more detailed economic variables in Care&WorkMOD, unit records from the concatenated SDACs reweighted to 2015 were linked with STINMOD output dataset for 2015 using synthetic matching (Rässler, 2002). This is a commonly used process in microsimulation to create a synthetic dataset by matching individual records from more than one dataset when they have information collected through different sources on the same population but do not have common unique record identifiers for the exact matching of individual records (record linkage).
The authors have previously used this method to develop synthetic datasets for earlier microsimulation models — Health&WealthMOD and Health&WealthMOD20330. The process was described in detail in Schofield, Cunich, Shrestha et al. (2014). Briefly, the process involves identifying a set of matching variables that are common to both datasets (i.e. the reweighted SDAC and STINMOD output), and strongly related to the main outcome of interest. We used “income” as our main outcome and nine variables (Table 1) as matching variables in Care&WorkMOD. During the matching process, unit records in two datasets are first grouped into homogeneous cells based on the matching variables. Each unit record within a cell from one dataset is then synthetically linked with the closest matching record, with replacement (an unconstrained matching), from the corresponding cell of another dataset. We used a standardized Euclidean distance method with the distance based on all nine matching variables to identify the closest matching records between the corresponding cells of the reweighted SDAC and STINMOD output datasets. In order to avoid creating cells which have records in concatenated SDAC dataset but no record in STINMOD, which will result in the missing data for those records in the synthetic dataset, we prioritised the matching variables and grouped them into two groups; with priority matching variables grouped into Group A (Table 1). Cells were first created based on Group A variables and the records in each cell were further grouped into smaller cells based on Group B variables. In some instances, cells were created using a fewer number of Group B variables to avoid having cells with no record in STINMOD when we have records in the SDAC dataset for the corresponding cells. If there was a cell with no matching record in STINMOD, we grouped those cells with a neighbouring cell. The method of creating cells for synthetic matching is described in detail in Schofield, Shrestha, Kelly, et al. (2014).
Synthetic matching variables and their categories in Care&WorkMOD.
| Matching variables | Categories |
|---|---|
| Group A | |
| Labour force status | Employed full-time |
| Employed part-time | |
| Unemployed looking for work | |
| Not in the labour force | |
| Income unit type | Married couple with dependents |
| Married couple only | |
| One parent with dependents | |
| One person | |
| Income quintile | 1st quintile |
| 2nd quintile | |
| 3rd quintile | |
| 4th quintile | |
| 5th quintile | |
| Sex | Male |
| Female | |
| Age group | 15–19 years |
| 20–24 years | |
| 25–29 years | |
| 30–34 years | |
| 35–39 years | |
| 40–44 years | |
| 45–49 years | |
| 50–54 years | |
| 55–59 years | |
| 60–64 years | |
| Group B | |
| Hours worked per week | Not applicable |
| 1–15 hours | |
| 16–24 hours | |
| 25–34 hours | |
| 35–40 hours | |
| 41+ hours | |
| Highest level of educational qualification | University |
| Non-university | |
| Home ownership | Yes |
| No | |
| Receiving Carer Payment | Yes |
| No |
2.7.1 Synthetic matching results
About 95.5% of concatenated SDAC unit records were synthetically matched with STINMOD unit records of the same category for each of the nine matching variables (Figure 4). Records were matched in the same categories for all records for at least five matching variables. An analysis of how closely SDAC unit records matched with STINMOD unit records for each matching variable showed that all variables were matched within 3% accuracy (Table 2). Out of nine matching variables, age group had the highest rate of matching error at 2.9%; however, most of these errors were due to records in one age group matching with the records from one step above or one step below age groups (e.g. records from 45–49 years age group matching with the records from either 41–44 or 50–54 years age group).

Percentages of matched records by the number of matching variables.
Error rates in synthetic matching by matching variables.
| Matching variables | No of SDAC records matched with STINMOD record of different category | % |
|---|---|---|
| Labour force status | 0 | 0.0% |
| Income unit type | 0 | 0.0% |
| Income quintiles | 6 | 0.0% |
| Sex | 135 | 0.1% |
| Age group | 3217 | 2.9% |
| Hours worked per week | 1007 | 0.9% |
| Highest level of education | 344 | 0.3% |
| Home ownership | 308 | 0.3% |
| Receiving carer payment | 395 | 0.4% |
2.8 Indexation of economic data
Economic data such as income, tax, welfare payments, assets, and savings in Care&WorkMOD were based on STINMOD output dataset for 2015. The model uses 2015 Australian labour market data and Australian Government’s 2015–16 income tax and welfare policies. Income and other economic data were indexed to reflect the economic growth projections from 2015 to 2030. Income and taxes paid by individuals were assumed to grow at a rate of 1% per annum in real terms (i.e. 1% above Consumer Price Index (CPI)) based on the projected long-term income growth (The Treasury, 2015b). Welfare payments can broadly be grouped into two categories: pensions, which mainly included Age Pension, Disability Support Pension and Carer Payments, and allowances which included New Start Allowances and Youth Allowances. The allowance part of welfare payments was assumed to have no real growth (i.e. same as CPI growth) based on the Australian Government’s policy of increasing welfare payments other than pension in line with CPI growth (The Treasury, 2015b). The pension part of welfare payments were assumed to grow at the same rate as income growth, with a 1% real growth per annum, again, in line with current government policing.
To capture savings and assets growths, we estimated annual growth rates for superannuation, housing, cash and shares. The projected growth rates were based on 10-year data from 2005–2015 for superannuation, housing, cash deposits and equities (Reserve Bank of Australia, 2017). The projected annual real growth rates used were 3.5% for superannuation, 2.9% for housing (including investment properties), 1.5% for cash deposits and 2.5% for shares and other financial investments (Reserve Bank of Australia, 2017).s
3. Discussion
We have developed a new model, Care&WorkMOD, to project the economic impacts of informal care of people with chronic disease, leading to people aged 15 to 64 years leaving the labour force early, over the years 2015 to 2030. This model simulates the impacts of an ageing population, different labour force participation patterns, and income and savings trends. Care&WorkMOD can be used to calculate (i) the number of people who left the labour force due to caring for people with chronic disease; (ii) the lost income and savings of people who have left the labour force due to caring for those with ill health, compared to those who continue in paid employment; and (iii) the extent of these losses due to demographic, disease, or economic trends across 2015, 2020, 2025 and 2030. Care&WorkMOD can also be used to estimate possible long-term economic productivity gains from informal carers returning to the labour force as a result of interventions that address individual health conditions, including mental health disorders and heart disease.
The application of microsimulation to social and economic modelling was pioneered in the late 1950’s (Orcutt, 1957). Since then, microsimulation modelling has evolved to use current computing power and available datasets, allowing sophisticated dynamic microsimulation modelling. The use of a dynamic microsimulation model for long-term projections is now wide spread and well- established (Li & O’Donoghue, 2013). In a dynamic microsimulation model, individuals transit from one stage to another in regular unit of time, commonly every year, based on transition probabilities. With this, the model can simulate a life trajectory of an individual, such as informal carers’ entry to labour market, exit from the labour market, re-entry into the market and permanently exit from the labour market. This allows the simulation of working years of every individual in the model. However, building a dynamic microsimulation model is resource intensive, time consuming and can be costly (O’Donoghue, Li, & Dekkers 2014). In this instance, we chose the less complex and labour intensive model structure. We therefore built a static microsimulation model, Care&WorkMOD, which uses static ageing through reweighting data and synthetic matching methods instead of building it as a dynamic microsimulation model. Static ageing is defined here as a model that simulates time indirectly through uprating or ‘reweighting’ (Dekkers, Keegan, & O’Donoghue, 2014). In contrast, dynamic modelling alters the content of the dataset itself over time. We also have utilized the output datasets of two well-established Australian microsimulation models APPSIM and STINMOD in the process. The main advantage of building a microsimulation model this way is that it is faster to assemble, less computationally intensive and can take advantage of existing microsimulation models. However, as Care&WorkMOD depends upon outputs of APPSIM and STINMOD, its robustness depends upon the strength of APPSIM and STINMOD simulations and any underlying limitations in APPSIM and STINMOD will be carried over to Care&WorkMOD. For example, APPSIM does not have geographical subdivisions information and as a result, Care&WorkMOD has no geographical division information in its datasets. Thus, it limits the use of Care&WorkMOD to estimate the economic costs of informal carers’ early exit from the labour force only for individuals (i.e. informal carers) and the Commonwealth Government at a national level. The model does not provide the estimates at a state or regional level, which are outside the scope of Care&WorkMOD project. Since both APPSIM and STINMOD are well-established Australian models and are widely used (Lambert, Percival, Schofield, & Paul, 1994; Percival et al., 2007; Keegan & Kelly, 2009; Lymer, 2009), this gives confidence in the robustness of their output.
Care&WorkMOD created synthetic datasets by matching individual records of SDACs with records from a STINMOD output dataset based on matching variables through a synthetic matching process as opposed to the exact matching of individual records through record linkage. It is not possible to directly match SDAC records with STINMOD records because they use different samples, so the individuals in each survey are not the same people. Most importantly, the ABS does not allow an exact matching based on nine matching variables to create a synthetic population dataset, which is nationally representative sample of the Australian population. We therefore linked records from SDAC and STINMOD using synthetic matching based on nine matching variables to create a synthetic dataset which includes information from both original datasets. This method is commonly used in microsimulation models to create synthetic datasets (Hynes, Morrissey, & O’Donoghue, 2006; Von Randow, Davis, Lay Yee, & Pearson, 2012) and we have previously used this method in our earlier microsimulation models Health&WealthMOD and Health&WealthMOD20330 (Schofield et al., 2011; Schofield, Shrestha, Kelly et al., 2014).
One of the main limitations of synthetic matching is that records of one dataset can be matched with the records of different categories of matching variables in another dataset creating a mismatch in the categories of the same matching variables. The potential of this mismatch was limited in Care&WorkMOD by matching the closest records between two datasets using a standardized Euclidean distance method based on the nine matching variables. Care&WorkMOD has all SDAC records matched with STINMOD records of the same categories for up to five matching variables, with about 95% records matched for each of the nine matching variables. When looking at individual matching variables, each of the variables had a matching error rate of less than 1% except for age group, which had a matching error rate of 2.9%.
As the synthetic matching was based on the closest matching records using an unconstrained matching process, it was possible that multiple SDAC records have been synthetically linked with one STINMOD record or some of STINMOD records were not matched with any SDAC records. This means that there may be inherent differences in the distributions of economic variables in STINMOD and Care&WorkMOD, and as a result there is the potential for the distributions of economic variables not used as synthetic matching variables in Care&WorkMOD to be different from the original distributions in STINMOD. We note that one limitation of this study is that female carers aged 35–64 years were a higher proportion in actual SDAC 2015 data than projected (from the 2012 data). This indicates that these estimates are conservative and the number of informal carers may be higher.
The analysis of Care&WorkMOD output datasets will provide the results that will help fill gaps in current evidence on the costs of chronic diseases (e.g. pain, neurodegenerative diseases, mental illness, heart disease, and diabetes, and childhood onset cognitive and physical disability) and to estimate reductions in labour productivity of carers due to informal caring responsibilities, at a national and individual level. Findings from this microsimulation model may be used internationally, where other countries have the appropriate data available. Given that the population is ageing and the demand for informal caring is increasing in many countries, estimates of the economic costs of informal caring may be used to inform health polices across the globe. Economic impacts of informal carers leaving the workforce early for both individuals in terms of lost incomes and the National Governments in terms of additional welfare costs and lost tax revenues are likely to grow in future given most countries have a growing population of informal carers. Indeed, around 13% of people aged 50 and over report providing informal care at least weekly, and more than 20% in the Czech Republic and Belgium (Basu, Seligman & Bhattacharya 2013). It is noteworthy that the lowest rates of daily informal provision are found in Sweden, Switzerland, Denmark and the Netherlands, where the formal long-term care network is well developed and government provided coverage is thorough and comprehensive (Basu, Seligman, & Bhattacharya, 2013). Results from microsimulation on lost income and welfare payments can be used to inform government policymakers about the likely impacts on national productivity, and ways to increase workforce participation and standard of living of informal carers of chronic disease.
4. Conclusion
Here we describe the model structure, datasets used, and assumptions of a microsimulation model called Care&WorkMOD. The results from Care&WorkMOD, such as costs of welfare and lost taxes due to informal carers being out of the workforce, will enable policy makers to use accurate and reliable estimates of long-term costs of informal caregiving, leading to exit from the labour market (from both individual and government perspectives).
References
-
1
The economic value of informal care. Report to Carers AustraliaThe economic value of informal care. Report to Carers Australia.
-
2
Scoping the Australian Care Economy: A Gender Equity Perspective SecurityScoping the Australian Care Economy: A Gender Equity Perspective Security, 4Women Incorporated.
-
3
Fifth report of the funding and financing of the aged care sectorFifth report of the funding and financing of the aged care sector, Canberra.
-
4
Census of Population and Housing. CanberraCensus of Population and Housing. Canberra.
-
5
Disability, Ageing and Carers, Australia: Summary of Findings, 2015. CanberraDisability, Ageing and Carers, Australia: Summary of Findings, 2015. Canberra.
-
6
Nutritional policy changes in the supplemental nutrition assistance program: A microsimulation and cost-effectiveness analysisMedical Decision Making 33:937–948.
- 7
-
8
The impact of caring on informal carers’ employment, income and earnings: A longitudinal approachAustralian Journal of Social Issues 2:255–272.
-
9
“Its Not Just About the Dollars: Measuring and Reporting the Economic and Social Benefits of Standards under the Disability Discrimination Act” - a Forum held by the Disability Studies and Research Institute (DSaRI) in conjunction with the Social Relations of Disability Research Network (SRDRN)University of Technology, Sydney.
-
10
Regional Dimensions: Creating Synthetic Small-area Micro Data and Spatial Microsimulation Models. (NATSEM Technical Paper No. 33)NATSEM. Canberra.
- 11
-
12
New pathways in microsimulation
-
13
The economic value of informal care in Australia in 2015. Report to Carers AustraliaThe economic value of informal care in Australia in 2015. Report to Carers Australia, Canberra.
-
14
National spending on health by source for 184 countries between 2013 and 2040The Lancet 387:2521–2535.
-
15
The economic value of informal mental health caring in AustraliaMind Australia and University of Queensland. Queensland.
- 16
-
17
Determinants of the Labour Force Status of Female CarersAustralian Journal of Labour Economics 12:5–20.
-
18
Building a static farm level spatial microsimulation model: Statistically matching the Irish National Farm Survey to the Irish Census of Agriculture46th Congress of the European Regional Science Association.
-
19
APPSIM - Dynamic microsimulation modelling of social security and taxationCanberra: NATSEM.
- 20
-
21
A survey of dynamic microsimulation models: uses, model structure and methodologyInternational Journal of Microsimulation 6:3–55.
-
22
APPSIM: Modelling health. National Centre for Social and Economic Modelling (NATSEM)University of Canberra. Canberra.
-
23
Predicting the need for aged care services at the small area level: The CAREMOD spatial microsimulation modelInternational Journal of Microsimulation 2:27–42.
-
24
Projecting the need for Formal and Informal Aged Care in Australia: A Dynamic Microsimulation ApproachCanberra: NATSEM.
-
25
A comparison of the lifetime economic prospects of women informal carers and non-carers, Australia, 2007Australian Journal of Social Issues 46:91–108.
-
26
The effect of unpaid caregiving intensity on labour force participation: Results from a multinomial endogenous treatment modelSocial Science and Medicine 100:115–122.
-
27
Dynamic ModelsIn: C O’Donoghue, editors. Handbook of Microsimulation Modelling. Emerald Publishing Ltd.. pp. 305–343.
- 28
-
29
Modelling Our Future: Population ageing, health and aged careSTINMOD (Static Income Model), Modelling Our Future: Population ageing, health and aged care, Amsterdam, Elsevier B.V.
- 30
-
31
Care by Spouses, Care by Children: Projections of Informal Care for Older People in England to 2031Social Policy and Society 6:353–366.
-
32
Statistical matching: A frequentist theory, practical applications, and alternative Bayesian approachesNew York: Springer-Verlag.
-
33
RBA Statistical table E1 - Household and Business Balance SheetsRBA Statistical table E1 - Household and Business Balance Sheets, Sydney.
-
34
The economic impact of diabetes through lost labour force participation on individuals and government: evidence from a microsimulation modelBMC Public Health, 14, 220.
-
35
Modelling the cost of ill health in Health&WealthMOD (Version II): lost labour force participation, income and taxation, the impact of disease preventionThe International Journal of Microsimulation 4:32–36.
-
36
Counting the Cost: Part 2 Economic Costs: the current and future burden of arthritisReport to Arthritis Australia.
-
37
Health&WealthMOD20330: A microsimulation model of the long term economic impacts of disease leading to premature retirements of Australians aged 45–64 years oldInternational Journal of Microsimulation 7:94–118.
-
38
Economic costs of chronic disease through lost productive life years (PLYs) among Australians aged 45–64 years from 2015 to 2030: results from a microsimulation modelBMJ Open 6:e011151.
-
39
Understanding calibration estimators in survey samplingSurvey Methodology 22:107–115.
-
40
Unpaid informal caregivers in South Australia: Population characteristics, prevalence and age-period-cohort effects 1994–2014PLoS ONE, 11, 9.
-
41
Small area estimation using a reweighting algorithmJournal of the Royal Statistical Society: Series A (Statistics in Society) 174:931–951.
-
42
Intergenerational Report: Australia in 2055Intergenerational Report: Australia in 2055, Canberra.
-
43
Budget Paper No 1: Budget Strategy and Outlook 2015–16Budget Paper No 1: Budget Strategy and Outlook 2015–16, Canberra.
-
44
Data matching to allocate doctors to patients in a microsimulation model of the primary care process in New ZealandSocial Science Computer Review 30:358–368.
Article and author information
Author details
Acknowledgements
This study is part of continuing research funded by a National Health and Medical Research Council (NHMRC) Partnership Project (APP 1055037) with Pfizer Australia and Carers Australia as partner organisations. All authors are independent from the funding sources, and the funding sources (including Pfizer Australia) played no part in the research design, undertaking of the analysis, formulation or interpretation of the results, decision to publish the research findings, nor any other part of the research process. MP is funded by fellowships from the National Health and Medical Research Council, and the Sydney Medical School Foundation.
Publication history
- Version of Record published: December 31, 2018 (version 1)
Copyright
© 2018, Shrestha et al.
This article is distributed under the terms of the Creative Commons Attribution License, which permits unrestricted use and redistribution provided that the original author and source are credited.