Using statistics Canada LifePaths microsimulation model to project the disability status of Canadian elderly
- Université de Montréal, Canada
- Programme de démographie, Institut national de la recherche scientifique, INRS – Urbanisation Culture Société, Canada
Abstract
Complex population projections usually use microsimulation models; in Canada, Statistics Canada has developed a global dynamic microsimulation model named LifePaths in the Modgen programming language to be used in policy research. LifePaths provides a platform to build on for our research program, conjointly with Dr Janice Keefe from Mount Saint Vincent University, on projections of the Canadian chronic homecare needs for the elderly up to 2031 and of the human resources required. Beside marital status, family networks and living arrangements, future disability status of the elderly is a key variable, but an intricate one. Since disability status transitions were previously conditioned only on age and sex, we will use here the current disability module of LifePaths with longitudinal data from Canada’s National Population Health Survey (NPHS). These new disability status transitions are considering other significant explicative variables like marital status, education etc. We will then present projections of future Canadian elderly by disability status and a comparison with nine European countries for the Future Elderly Living Conditions in Europe (FELICIE) Research Program which has used the same approach. Our previous researches have shown the importance of future disability level for the management of an elderly society. The main output of the present paper would first produce, with new health scenarios, new estimates for Canada of elderly in poor health, for those aged 75 and over. Secondly, it would produce an interesting comparative analysis, useful especially for implementing new policies for the well-being of the Canadian elderly.
1. Introduction
Population aging among developed countries is well on its way. The growing proportion of the elderly population and the changes occurring within the whole age structure of the population threaten the sustainability of social security systems, especially with regards to pensions and health care (World Bank, 1994). In the next 25 years, the most important increases within the elderly population, both in Canada and Europe, are expected to occur among the oldest old, that is people aged 75 years old and over. This rapid growth reflects the aging of the baby-boom cohort as well as an improved survival to and beyond age 75. Although many older people remain in good health until quite advanced ages, risks of becoming disabled increase significantly at age 75 and over. The growing oldest old population has therefore important implications regarding support systems, both formal and informal (Carrière et al., 2006). Drawing conclusions on future needs from actual characteristics of the elderly may be misleading; since the elderly population of the future will be very different of those of today (Carrière et al., 2007). Therefore, in order to be policy relevant, elderly population projections and their implied needs for support should include covariates like marital status, living arrangements, health conditions, and potential support from surviving partner and children.
2. Background on previous disability projections
Mortality projections have been in the air for a long time for both actuaries and demographers, because high mortality was a public health issue in younger societies and death data have become more and more available. Major improvements were made when causes of death were included in death certificates through vital registration in developed countries.
We cannot say the same for morbidity projections. With a lower mortality and ageing societies, some of the focus have move from mortality to morbidity. But it is only through surveys that we can collect information on disabilities and population random sample surveys in the field of health were developed only in the second half of the XXth century. It is manly in the USA that large individual-level disability surveys, both cross-sectional and longitudinal, were initiated.
It is soon after the key article by Fries (1983) on the compression of morbidity that the research on disability trends (Verbrugge, 1984) and projections of disabled populations (Manton and Liu, 1984) emerged. With time, estimating the prevalence of long-term disability for an ageing society became a national priority (Kundel & Applebaum, 1991; Manton and Corder, 1998; Waidmann and Liu, 2000; Bhattacharya et al., 2004, to name a few).
Most of the previous studies produce their projections using multinomial logit and least square regressions techniques with the assumption that the current disability prevalence will stay at the same level throughout the projection period or that the trends observed in survey can by applies for the projection period. In our previous research project for example, (Carrière et al., 2007) even if our intent was to innovate by using microsimulation techniques, results coming from the then existing disability module in Statistics Canada LifePaths microsimulation model did not produce satisfactory results and we had to rely on classical methods.
In our the current research program and for the results presented in this study, we are in a position, as the LifePaths disability module has been much improved, to use the microsimulation modelit to project the number of disabled elderly in the Canadian population.
3. Objectives
3.1 First Objective
This study is part of a broader program of research aiming at producing a set of projections up to 2031 of the chronic homecare needs of Canadian elderly and the human resources required to assist them. The first objective of this paper is to assess the impact of an optimistic disability scenario on future numbers of elderly Canadian in poor health aged 75 years and over using Statistics Canada LifePaths microsimulation model. More specifically, a module to project future disability status of Canadian elderly was used to produce two scenarios: the Base LifePaths Disability scenario and the Healthy scenario in which it is assumed that additional years gained in life expectancy will be years without disability. We have calculated the proportion of the older population in poor health by linking disability status to marital status and surviving children.
3.2 Second Objective
The second objective of this study is to compare Canada with nine European countries (Belgium, Czech Republic, England and Wales, Finland, France, Germany, Italy, Netherlands, Portugal) who participate in the research program “Future Elderly LIving Conditions In Europe” (FELICIE). International comparisons are relevant because they allow the investigators to assess the specificities of Canadian aging. In this case, comparative data are available since two groups of researchers, one Canadian and one European, have been working in close collaboration in the field of the demography of aging. These research programs have now ended and the results have been widely disseminated within the national and international scientific community (see Carrière et al., 2007 and Gaymu et al., 2007). Both research programs produced microsimulated projections for the next 25 years that give comparable results on marital status, family network and support, and on living arrangements and needs for care. Here, the present research allows the health dimension to be comparable in order to use the same future health scenarios; in the first one the gain in life expectancy results in a proportional growth in the years in disability while in the second one the added years in life expectancy are years without disability.
4. Methods
4.1 Definition of disability
In this paper, disability was defined using some attributes of the Health Utility Index (HUI). The HUI, based on the Comprehensive Health Status Measurements System (CHSMS), takes into account both the quantitative and qualitative aspects of health (Torrance et al., 1996). It provides information on the functional health of an individual using a series of attributes. For the purpose of this study, information on an individual’s mobility, dexterity, cognition, and pain and discomfort were used to develop four levels of disability (none, mild, moderate, and severe):
No disability
Mild disability:
Mobility problems but do not need any help; Dexterity problems but do not need any help from someone else (may or may not use special equipments); Somewhat forgetful and slight difficulty in thinking; Moderate and/or severe pain prevents performing some or few tasks.
Moderate disability:
Requires wheel chair or mechanical support to walk; Dexterity problem and needs help to perform some tasks; Very forgetful and a lot of difficulty in thinking; Severe pain prevents performing most tasks.
Severe disability:
Cannot walk or needs help from others to walk; Dexterity problems and needs help for most or all tasks; Unable to remember or think.
4.2 LifePaths microsimulation model
The results in this paper are generated with a Canadian dynamic longitudinal microsimulation model called LifePaths. This model has been developed for several years by Statistics Canada in a programming language named Modgen. As described on the web site of Statistics Canada (Statistics Canada, 2004), this model is an overlapping cohort model that produces for each run a representative sample of the Canadian population. The oldest birth cohort represented in LifePaths was born in 1872. That year was chosen so that in the year 1971 the model would have a complete and representative set of all ages from newborns to the elderly. This means that starting in 1971 LifePaths produces cross-sectional annual tabulations that can be compared to historical data. The year 1971 is the first year for which high quality socio-demographic data were available in the form of a Census with contemporary design.
The life course of an individual, called a case, is simulated in LifePaths as a series of events that occur in continuous time (so they are not artificially restricted to annual intervals) using behavioural equations estimated from a large number of surveys and of historical micro-data sources. For example, the model use the National Population Health Survey (NPHS), School Leavers Survey (SLS), Labour Force Survey (LFS), National Graduate Survey (NGS), Family Historical Survey (FHS), General Social Survey (GSS), Census data, Historical Statistics of Canada and many others. All over the course of a simulation, LifePaths use the information coming form these data to keep updating its list of pending events to ensure that the next scheduled event is the one that currently has the shortest waiting time. This provides a straightforward way of dealing with competing events. Waiting times provide a unifying framework for representing decision-making. Probabilistic decisions can be implemented so that the choice among alternatives is determined by comparing two or more waiting times.
Moreover, a LifePaths simulation consists of a set of mutually independent cases. Each case contains exactly one dominant individual in the first generation. The spouse and children of the dominant individual are simulated as part of the case. They are created to satisfy the marriage and the fertility equations1.
4.3 Application of LifePaths microsimulation model
LifePaths takes into consideration a large number of variables representing events occurring in the life course of an individual. In the present research project, we have used a limited number of those variables:
Age
Sex
Schooling level
Region
Marital status
Age of spouse
Place of birth
Surviving children
Disability (and institutionalization)
It is important to keep in mind that LifePaths is a dynamic model implying that some other variables not listed here can affect the results.
Another important concept in a model like LifePaths is the Monte Carlo variation. All cases simulated in this model are using waiting times that incorporate a stochastic component. It is one of the reasons why LifePaths can reproduce the diversity observed in real populations. On the other hand, this variability affects the reliability of aggregate tabular results in the same way results taken from a small sample would be affected if drawn from a large population. In order to avoid this kind of problem occurring when dealing with rare events, we decided to simulate as many as six million cases for both base and healthy scenarios.
One of the key variables of this project and of all studies concerning chronic homecare needs of the elderly is disability. The data taken into account to generate this variable in the LifePaths module that we used are coming from Canada’s National Population Health Survey (NPHS). The NPHS first cycle of data collection took place in 1994–1995 and will continue every second year thereafter for 20 years. The NPHS fulfilled both cross-sectional and longitudinal needs during its first three cycles, but with Cycle 4 (2000–2001) this survey became strictly a longitudinal one with two components: the household survey and the health care institutions survey (Rowe, 2006).
This study presents simulation results for the period 2001 to 2031. Year 2001 is our baseline because it was the last Canadian Census with most available results, and 2031 is corresponding to the year when the bulk of the baby-boomers will reach the age of 75, an age when physical and mental impairments rise rapidly.
The last part of this study is a comparison of the situation of Canada with FELICIE countries. One should be aware that the disability module in LifePaths is dynamic whereas it is static in the model of the European team. Static microsimulation models typically use static aging techniques, changing certain variables on the original micro-data file to produce a file with the demographic and economic characteristics expected in the future years. Person weights are modified to change the total population and the weighted characteristics of the population. Dynamic microsimulation models age each person in the micro-data file from one year to the next by probabilistically deciding whether or not that person will get married, get divorced, have a child, drop out of school, get a job, change jobs, become unemployed, retire, or die.
4.4 Current limits of LifePaths microsimulation model
In the current version of LifePaths, there are no transition probabilities for some variables necessary to reach our research program objectives. Consequently, by using cross-sectional information, we have estimated the probabilities of classifying each factor/covariate pattern in the different categories of these variables. In this paper, however, it is not an issue because the projections do not involve these variables.
Indeed, the projections of Canadian chronic homecare needs (which is the main objective of our research programme) involve cross-sectional incorporation of parameters related to key variables. The left part of Figure 1 lists the characteristics needed for this cross-sectional part of the projections. The microsimulation model produces additional characteristics for each individual, but only the ones presented in Figure 1 are used. We first have to run the microsimulation to obtain the population by age, sex, schooling population, since married individuals are assumed to live with their spouse.

The projection model.
4.5 Modelling of health
To evaluate the health status of a population, demographers and epidemiologists have created some indicators based on life table’s parameters (Robine et al., 1991). Here, we use the Disability Free Life Expectancy (DFLE) The total Life Expectancy (LE), all health status combined, could be divided in two parts: DFLE and Life Expectancy level, region of residence, marital status, age of spouse, place of birth, and number of surviving children. We also need to differentiate who lives in an institution and who lives in a private household. Only the population living in private households is kept since by definition home care services are strictly aimed at this population. This first step provides a picture of the Canadian population for any given year up to 2031 according to the characteristics on the left of Figure 4. Probabilities of disability status need for assistance, living arrangement, receipt of assistance, and source of assistance are then applied to these populations in the sequence shown in Figure 1. As shown, there is an assumption that living arrangements are partly determined by the need for assistance. Thus, living with others is partially seen as a strategy to cope with a need for assistance related to a disability. This was done only for the non-married with Disability (LEWD). LEWD can be calculated by multiplying persons-years in the life table by disability rates by age using the Sullivan Method. Then, LEx = DFLEx + LEWDx (x = age) (1)
Recent trends show that LE, as well as DFLE and LEWD, increases with time (Table 1 and Table 2). The healthy scenario keeps the LEWD, 11,3 years, at the same level throughout the projection period, meaning that all added years in life expectancy are disability free years. In this paper, all additional disability free years will be added to DFLE at age 45 as our target population is the elderly aged 75 + from year 2001 to 2031.
Trends in Canadian life expectancy and disability free life expectancy at birth with the base scenario.
| Year | Life expectancy (LE) | Disability free life expectancy (DFLE) | Life expectancy with disability (LEWD) |
|---|---|---|---|
| 2001 | 78.0 | 63.8 | 14.2 |
| 2011 | 79.7 | 64.6 | 15.1 |
| 2021 | 81.2 | 65.2 | 15.9 |
| 2031 | 82.4 | 65.7 | 16.7 |
-
Source: Results from LifePaths model.
Trends in Canadian life expectancy and disability free life expectancy at age 45 with the base scenario.
| Year | Life expectancy (LE) | Disability free life expectancy (DFLE) | Life expectancy with disability (LEWD) |
|---|---|---|---|
| 2001 | 34.8 | 23.5 | 11.3 |
| 2011 | 36.1 | 24.0 | 12.1 |
| 2021 | 37.3 | 24.4 | 12.9 |
| 2031 | 38.3 | 24.7 | 13.7 |
-
Source: Results from LifePaths model.
5. Microsimulation results2
5.1 Disability status of Canadian elderly
Even if there is no doubt that there are close links between mortality and morbidity, the first one is quite simple to measure while measuring the health of a person or a population is quite more complex. There is no unanimity about definitions of what we refer to when we say that a person is in good health or poor health.
However, many people agree that a measure of health should be closely linked to disability: the ability to independently perform activities of daily living (Cambois et al. 2005). To be in poor health then refers to a person that is in need of care and eventually formal services. Given the four levels of disability defined previously in Canadian surveys, it is usually admitted that those with no disability or with a mild disability are considered in good health, leaving in the poor health group those with a moderate or a severe disability and of those living in institutions.
Past trends in disability status are not very straightforward and most of the time it is impossible to assert if in the future we will face an extension or a compression of morbidity (Robine, 2005). In the present study, the parameters of our base LifePaths scenario are kept constant throughout the projected period, while in our healthy scenario the additional years gained in life expectancy are assumed to be healthy years which means a compression of morbidity.
In 2001, there are approximately two men for every three women in the population in poor health aged 75 years and over (Table 3). However regardless of the scenario an increase of men in poor health is expected to occur at a much faster pace than for women in the decades to come. One must keep in mind that the sex-related differential of life expectancy is expected to decrease. But the sharp increase in number of people in poor health from 2021 on is mostly due to the baby-boomers reaching the age of 75.
Canadian people aged 75+ in poor health*, according to two scenarios, 2001 to 2031.
| Year | MEN | WOMEN | |||
|---|---|---|---|---|---|
| Base scenario | Healthy scenario | Base scenario | Healthy scenario | ||
| n2001 | 196 019 | 192 900 | 307 787 | 302 924 | |
| Standardized to 100 in 2001 | 2001 | 100 | 100 | 100 | 100 |
| 2011 | 149 | 122 | 134 | 110 | |
| 2021 | 213 | 170 | 180 | 145 | |
| 2031 | 333 | 271 | 270 | 226 | |
-
Source: Results from LifePaths Model.
-
*
People in poor health are those moderately or severely disabled.
In order to have the healthy scenario become effective from 2001, the disability parameters have been modified from 2000, thus making small differences in the numbers of people in poor health.
The size of the family network of people in poor health is a key determinant of their probability to rely on formal home care services. Consequently, it is important to assess how many of those individuals can benefit of the presence of surviving children. In the present study, the use of microsimulations and the substantial numbers of simulated cases generate a much more complete portrait than what could have been obtained with a survey sample. In 2001, elderly men and women in poor health without surviving children show similar proportions; however the situation of men in the next decades is expected to evolve more rapidly than women. As mentioned above, most of the increase takes place between 2021 and 2031, period during which most baby-boomers will reach the age of 75 (Table 4).
Canadian people aged 75+ in poor health* without surviving children, according to two scenarios, 2001 to 2031.
| Year | MEN | WOMEN | |||
|---|---|---|---|---|---|
| Base scenario | Healthy scenario | Base scenario | Healthy scenario | ||
| n2001 | 49 606 | 48 768 | 59 125 | 58 421 | |
| Standardized to 100 in 2001 | 2001 | 100 | 100 | 100 | 100 |
| 2011 | 128 | 106 | 108 | 89 | |
| 2021 | 163 | 131 | 127 | 103 | |
| 2031 | 277 | 223 | 224 | 182 | |
-
Source: Results from LifePaths Model.
-
*
People in poor health are those moderately or severely disabled.
Elderly people experiencing the highest risks of being dependent of formal sources of assistance are those with a reduced family network, that is people without neither a spouse nor surviving children. Even if people in such a situation represents slightly more than 15% of all the individuals aged 75 and over in poor heath, the numbers will increase sharply for men throughout the projection period, whereas the women situation will vary slowly and even improve before 2021 in the healthy scenario (Table 5).
Canadian people aged 75+ in poor health* not married* and without surviving children, according to two scenarios, 2001 to 2031.
| Year | MEN | WOMEN | |||
|---|---|---|---|---|---|
| Base scenario | Healthy scenario | Base scenario | Healthy scenario | ||
| n2001 | 29 590 | 29 063 | 49 744 | 49 131 | |
| Standardized to 100 in 2001 | 2001 | 100 | 100 | 100 | 100 |
| 2011 | 137 | 113 | 106 | 87 | |
| 2021 | 178 | 142 | 120 | 96 | |
| 2031 | 323 | 255 | 204 | 161 | |
-
Source: Results from LifePaths model.
-
*
People in poor health are those moderately or severely disabled.
-
**
Married people include people in Common Law Union.
5.2 A comparison with FELICIE countries
Such an exercise for the Canadian population is very interesting per se, but an international comparison brings the specificities of the aging situation in Canada for the coming years into focus.
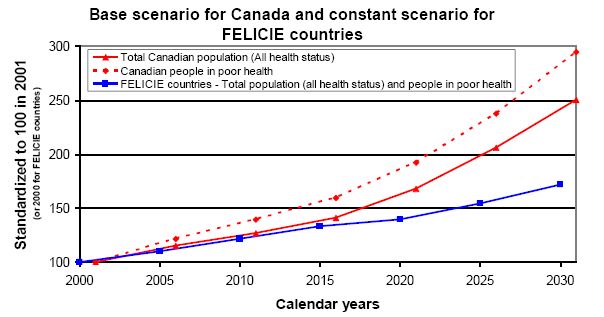
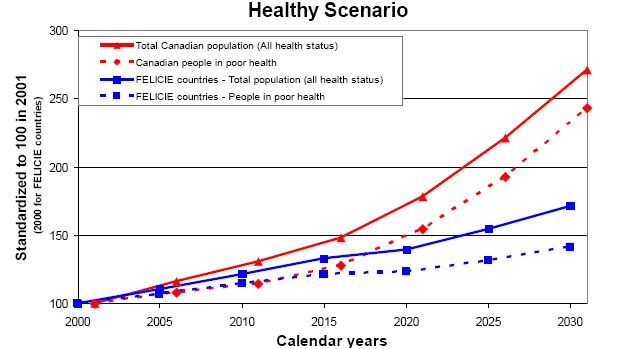
Regardless of the scenario, the growth of the Canadian total population aged 75 and over is expected to be substantially more important than in European countries for the period 2001–2031. More specifically, the Canadian elderly population will be multiplied by approximately 2.5 while in Europe it will increase by 1.5 (Figure 1 and Figure 2).

Trends in total population (all health status) and people in poor health, aged 75+, Canada and FELICIE countries.
One can observe that the numbers of elderly Canadian in poor health will significantly increase, especially from year 2021 on. In the base scenario, the growth in Canada will be twice as important during the period 2021–2031 compared to the two preceding decades.
Since the base scenario for Canada creates an expansion of morbidity without any modification of the disability parameters, this expansion is only due to the varying characteristics of the population at risk. The results for FELICIE countries are quite different because in the constant disability scenario it is assumed that the share of years lived in disability remains constant (Gaymu et al., 2007). Thus, we can clearly see that, in Figure 2, both curves for total elderly population and for elderly in poor health are absolutely the same since they are superposed.
6. Policy relevance of our results
In our opinion, it is of interest for both the scientific community and the Canadian policy makers to put the Canadian case into an international perspective. Up to 2015, trends in total and disabled population aged 75 and over are similar. From 2015 on, the impact of a larger baby-boom in Canada differentiate considerably Canada from FELICIE countries both in terms of total and disabled populations.
A comparison with European countries is particularly relevant for two dimensions. First of all, the aging process is more “mature” in these countries than in Canada. Secondly, the Canadian social security system shows more similarities with the European ones than with the American one. Elderly demographics have impacts on policies designed both for the elderly and their carers. Obviously, contextualising the Canadian situation among other European industrialized countries would allow Canada to benefit from to the experience of countries like France and Germany that are more advanced in terms of alimonies to persons cared and/or their carers.

Trends in total population (all health status) and people in poor health, aged 75+, Canada and FELICIE countries.
Policy makers should however be aware that, as Wolfson and Rowe (2004, p.8) has outlined it : “such results are a lower bound of “needy” elderly because we have not taken into account of whether the adult children live nearby, nor whether the adult child or spouse is in sufficient good health that he or she could in fact provide support”.
7. Conclusion
Simulating the Canadian population with an optimistic disability scenario largely reduce the number of Canadian elderly aged 75 years and over in poor health. In 2031, we should find approximately 20% less people in poor health in the healthy scenario than in the base scenario. Moreover, the base scenario predicts a small expansion of disability due to the internal changes occurring in the characteristics of the Canadian population and that are taken into account by LifePaths. Consequently, the differences between the number of Canadian elderly in poor health and those observed in FELICIE countries are larger than expected because their constant scenario keeps their disabled people in the population at the same proportion throughout the period.
Furthermore, up to 2015, the relative increase in the Canadian and in the FELICIE countries total population (all health status) and people in poor health aged 75 years and over is similar. Afterwards, the impact of the larger baby-boom that occurred in Canada differentiates considerably the latter from FELICIE countries in terms of total population (all health status) and people in poor health. Indeed, both the total population aged 75 and over and the sub-population in poor health are expected to grow more rapidly in Canada than in Europe. Concerning the total populations, the difference between Canada and Europe is larger in the healthy scenario because both disability and mortality levels are linked together in the Canadian microsimulation model.
Finally, one must keep in mind that reaching the age of 75 corresponds to the beginning of a frailty period, implying increased needs for specific care. The rapid growth of our projected Canadian elderly population should raise the awareness of Canadian policy makers about the issues on future homecare needs and homecare services. Thus, tomorrow’s problems can be avoided by today’s actions.
Footnotes
1.
For more detailed information on Statistics Canada LifePaths microsimulation model, see Statistics Canada (2004).
2.
This analysis is based on Statistics Canada’s LifePaths microsimulation model. The assumptions and calculations underlying the simulation results were prepared by Yann Décarie and Jacques Légaré and the responsibility for the use and interpretation of these data is entirely that of the authors.
References
-
1
Disability forecasts and future Medicare costsForum for Health Economic & Policy 7:73–94.
-
2
The influence of functional limitations and various demographic factors on self-reported activity restriction at older agesDisability and Rehabilitation 27:871–883.
-
3
Population aging and immediate family composition: Implications for future home care servicesGENUS LXIII:11–31.
-
4
Socio-demographic factors associated with the use of formal and informal support networks among elderly CanadiansIn: Y Zeng, E Crimmins, Y Carrière, J-M Robine, editors. Longer Life and Healthy Aging, 2. Dordrecht, The Netherlands: Springer, International Studies in Population. pp. 287–304.
- 5
-
6
Who will be caring for Europe’s dependent elders in 2030?Population: an English selection 62:675–706.
-
7
Estimating the prevalence of long-term disability for an aging societyEstimating the prevalence of long-term disability for an aging society, U.S. Department of Health and Human Services.
-
8
The future growth of the long-term care population: projections based on the 1977 National Nursing Home Survey and the 1982 Long-Term Care Surveypaper presented at the, Third National Leadership Conference on Long-Term Care Issue.
-
9
Forecasts of future disabled and institutionalized U.S. populations 1995 to 2040327–348, Forecasts of future disabled and institutionalized U.S. populations 1995 to 2040, Ageing, Sicial Security and Affortability, chapter 4.2.
-
10
Are we living longer and in better health?. Paper presentation as a discussant at theAre we living longer and in better health?. Paper presentation as a discussant at the, AGIR Final Conference, March 10, 2005, Brussels, AGIR is project of The European Network of Economic Policy Research Institutes, www.enepri.org.
-
11
Healthy life expectancy: evaluation of a new global indicator of change in population healthBritish Medical Journal 302:450–460.
-
12
Analysing health status transitions using NPHS longitudinal dataOttawa: SEAMD, Statistics Canada.
- 13
-
14
Multiattribuable utility function for a comprehensive Health Status Classification System, Health Utilities Index Mark 2Medical Care 34:702–722.
-
15
Long life but worsening health? Trend in health and mortality of middle-aged and older personMilbank Memorial Fund Quarterly/Health and Society 62:475–519.
-
16
Disability trends among elderly persons and implications for the futureJournal of Gerontology: Social Sciences 55b:S298–S307.
-
17
Disability and informal support: Prospects for CanadaIn: SB Cohen, JM Lepkowski, editors. Eight Conference on Health Survey Research Methods. Hyattsville, MD: National Center for Health Statistics. pp. 15–22.
-
18
Averting the old age crisis: Policies to protect the old and promote growthNew York: Oxford University Press.
Article and author information
Author details
Acknowledgements
We would like to thank all people who have helped us in building this research project: Dr Geoff Rowe from Statistics Canada, Dr Janice Keefe from Mount Saint Vincent University, and all the members of our research team (Équipe de Recherche sur le Vieillissement des Populations – ERVIPOP). Financial support was provided by the Alzheimer Society of Canada (§ 0640) and the Canadian Institutes of Health Research ( MOP-81108).
Publication history
- Version of Record published: December 31, 2011 (version 1)
Copyright
© 2011, Légaré and Décarie
This article is distributed under the terms of the Creative Commons Attribution License, which permits unrestricted use and redistribution provided that the original author and source are credited.