Constructing a basefile for simulating Kunming’s medical insurance scheme of urban employees
- Second Military Medical University, China
- University of Canberra, Australia
- Bureau of Labour and Social Security of Kunming, China
- Office of Medical Insurance at No. 43 General Hospital, China
Abstract
Focusing on China’s medical insurance scheme which covers all employers and employees in urban areas, this research aims to assess the distributional impacts of medical insurance policies and to predict medical expenses by using microsimulation techniques. As an important part of the project, this article provides a brief overview of China’s medical insurance reform of urban employees and detail the techniques and processes to construct a basefile in 2005 for projecting the medical expenditures for urban employees over the period of 2006–2010. The main data used are administrative medical records of medical insurance participants provided by the Bureau of Labour and Social Security of Kunming, Yunnan Province. Along with the initial analysis for the raw datasets and age processing and adjustment for the individual records, monthly income information was imputed and personal savings accounts were established for each individual record. Important modelling parameters such as death rates and income adjustment factors were constructed. Furthermore, this article identifies medical insurance for government officials by using the combination of logarithm curve fitting and binary discriminant analysis. Based on this basefile, a static microsimulation model can be built to assess the implementation effects of the medical insurance policy and analyse the impact of the medical insurance scheme on urban employees.
1. Introduction
As an important part of the national social security system in China, medical insurance plays an important role in providing basic medical services to employees, promoting social and economic development, and maintaining the social security. Commencing in 1995, with Zhenjiang and Jiujiang as the two pilot cities, a new medical insurance system in China which covers all employers and employees in urban areas was established in December 1998. This medical insurance system covers all employers and employees in urban areas working in government organizations, enterprises, social groups and non-profit-making bodies (State Council 2004; Xu 2007).
Under this system, two accounts are established – personal savings accounts and the social pool fund. Each of these caters to a different type of medical care, that is, ordinary illness and serious illness, respectively. The funds for the medical insurance mainly come from premiums paid by both employers and employees. In principle, the employer contributes about 8 per cent of the total wage bill, of which 30 per cent is credited to the employee’s personal savings account and the balance paid into the social pool fund. An employee pays 2 per cent, which is fully credited to his or her personal savings account. Retirees are exempted from paying the premiums (State Council 2004).
Medical expenses are shared by the medical insurance fund and the individuals themselves. Medical services in clinics are mainly paid from a personal savings account, while hospitalization expenses are paid predominantly from the social pool fund. Efforts have been made to ensure that the insured have access to necessary medical services, to curb unreasonable medical expenses, and to enhance the utilization efficiency of the basic medical insurance fund. By the end of 2006, a total of 157.32 million employees and retirees around China had joined this basic medical insurance scheme. Of these, 115.80 million were employees, representing 40.90 per cent of the total employed (283.10 million) (MLSS and NBS 2007).
After ten years of medical insurance reform in urban areas, China has both gained significant achievements but faces lots of challenges. In July 2005, the Development Research Centre of China’s State Council and the World Health Organization jointly published a study titled “China’s Reform of the Medical and Health System.” The study came to the conclusion that the reform of the national medical system is “basically unsuccessful” (DRC State Council 2005). The study reported that medical institutions had become over commercialized and failed to meet the public’s medical needs.
Later in May 2006, the research group of “the report of China’s medical and health reform” issued a green book of “Medical and Health 2006” (Dong 2006). The green book believed that the ten-year medical insurance reform indeed led to many problems, especially low fairness in access to medical services and low efficiency in funding of health. In the wake of this research, health care reform in China has been the subject of much discussion and public debate. There is no doubt that further expanding the coverage of social medical insurance and reducing the proportion of self-payment continue to be top priority on the government agenda.
To tackle the problems, China’s State Council announced a new medical reform plan in early April 2009, which is aimed at providing fair and affordable services for all 1.3 billion residents by 2020 (Lan et al. 2009). The plan promised to restore the welfare nature of public hospitals and tackle four key areas: universal access to basic health insurance, the introduction of an essential medicine system, improved primary health care facilities and equal access to basic public health services. The plan aimed at creating a comprehensive medical insurance system composed of basic medical insurance for urban employers and employees, basic medical insurance for urban residents and a new rural cooperative medical care program, which will cover 90 percent of the population by 2011.
This article reports the processes and techniques underlying the creation of a basefile, which will be used to analyse the impact of the medical insurance reform on employees’ health care benefits – in particular, on their financial burden due to medical expenses (Xiong et al. 2007). The key aims are to assess the distributional impacts of medical insurance policies and to predict the medical expenses for urban employees and employers by creating a static microsimulation model (Brown et al. 2004; Harding & Gupta 2007; Gupta & Basu 2007; Schofield et al. 2009). With 2006 as the commencement year, the model forecasts the urban medical insurance policies and their settings for five years until 2010.
Such a static microsimulation model mainly contains two parts – creating a basefile for 2005 and projecting the implementation of the medical insurance policy over the period of 2006–2010. Constructing the basefile is an important part in creating the static microsimulation model. This paper describes the steps involved in creating the basefile for modelling the medical insurance scheme of urban employees and retirees.
2. Microdata sources used in the model
2.1 Basic information of Kunming
This project focused on the medical insurance system of the city of Kunming. Kunming, the capital of Yunnan Province, is located in South-west China, with a total population of 6.08 million at the end of 2005. Kunming commenced its medical insurance reform in April 2001. About 1.08 million urban employees were covered by the scheme at the end of 2005 (Kunming Medical Insurance Centre 2006), including employees and retirees of all government agencies, public institutions, enterprises, mass organizations and private non-enterprise units.
Like the other urban areas in China, the basic medical insurance funds in Kunming include the basic medical insurance pool fund (Social pool fund) and the basic medical insurance personal savings account (Personal savings account). The social pool fund is mainly responsible for hospitalization expenses, while the personal savings account for medical expenses in clinics. Apart from these two funds, there are several compensation programs like the other urban areas of China, of which the serious illness fund and the government official fund are the two main funds (Kunming Medical Insurance Association 2004).
2.2 Source of microdata
The main data used in this research are administrative medical records of the basic medical insurance participants. The Bureau of Labour and Social Security of Kunming provided the personal information of the insured individuals and the expenditure records of their medical services for the period of 2001–2005. In detail, there are five kinds of datasets used in creating the microsimulation model which are briefly described below:
Basic individual datasets
These datasets provide individuals’ basic information over the period of 2001–2005, and include mainly the variables of: personal identifier, gender, nationality, date of birth, date of initial job, employment status, education degree, individual status, date of entry medical insurance scheme, blood type, marital status. These variables provide the demographic information of individuals who joined the medical insurance scheme.
Individual status alteration datasets
These datasets provide individual status alteration records of medical insurance participants over the period of 2001–2005, including variables: personal identifier, type of alteration (e.g. newly registered participant, quit insurance scheme, retired), reason of alteration, date of alteration.
Medical insurance premium datasets
These datasets record the amount of contributions by individuals and their employers to the basic medical insurance scheme over the period of 2001–2005. The datasets mainly include variables of: personal identifier, employment status, corresponding period of premium, monthly income of participants, amount of money contributed by employees, amount of money went to personal saving accounts by employers, amount of money went to social pool fund by employers.
Medical expenses datasets of hospitalization and special disease treatment
These datasets provide the medical expenditure records of insured participants in both hospitalization and special disease services for the year from 2002 to 2005. The datasets mainly include variables of: personal identifier, employment status, hospital identifier (used to distinguish the level of a hospital, like large, medium, or small), total medical service cost, the amount shared by the social pool fund, type of payment (e. g. admitted to hospital, special disease, emergency service, chronic disease treatment), the expense shared by serious illness fund.
Medical expenses records of ordinary clinic treatment and medication
These datasets provide the medical expenditure records of clinic medical services and medication in pharmacies of insured participants over the period of 2001–2005. The datasets mainly have variables of: personal identifier, employment status, total medical services fees, date of medical services, type of payment (ordinary clinic treatment or medication in a pharmacy).
The above five datasets were linked with each other through unique personal identifiers and formed the whole medical insurance data sources of the participants for the period of 2001–2005. The unique personal identifier was assigned to each individual and available in all data sets for the individuals’ record. This made up the detailed information base data for the modelling construction.
2.3 Initial data processing and editing
In the initial analysis for the raw datasets, the mistyping codes were corrected and some codes for one variable with the similar meaning were combined. For example, male in variable of ‘gender’ was coded ‘1’, but some records had code ‘01’ or character ‘male’. Similar problems were detected with variables of ‘employment status’, ‘blood type’ and ‘marital status’. These problems were solved manually. The other data processing included the combination of some variable codes. For example, there were more than ten kinds of employment status types in the raw datasets for the variable of ‘employment status’. But the frequency analysis showed that, in general, there are mainly two kinds of participants, that is, employees (may work in enterprises, self employed, employed in a flexible manner, self employed after retire etc.) and retirees (retired from work, settlement in different places after retire). In the data processing, such kinds of variable codes were combined.
Primary settlement with the raw datasets for the year 2005 was then made, particularly for the individual’s demographic information. PROC FREQ in SAS software (SAS 2008) was used to get distributions of variables such as ‘age’, ‘gender’, ‘employment status’, in order to find the percentage of missing data for the variables. For example, there were 28,308 records with their age missing (accounting for 3.22 per cent of total participants) in the basic individual dataset because of missing scheme entry date (an individual’s age was obtained by scheme entry date minus the date of birth). Calculating the scheme entry age is needed for the purpose of calculating the premium allocation to the personal savings accounts by employers. The percentage of allocation may be different for individuals with different ages. This problem was solved by using the entry date records in the status alteration dataset, in detail, sorting the two datasets by personal identifier respectively and then merging them by personal identifier to compensate the missing scheme entry date.
2.4 Framework for construction
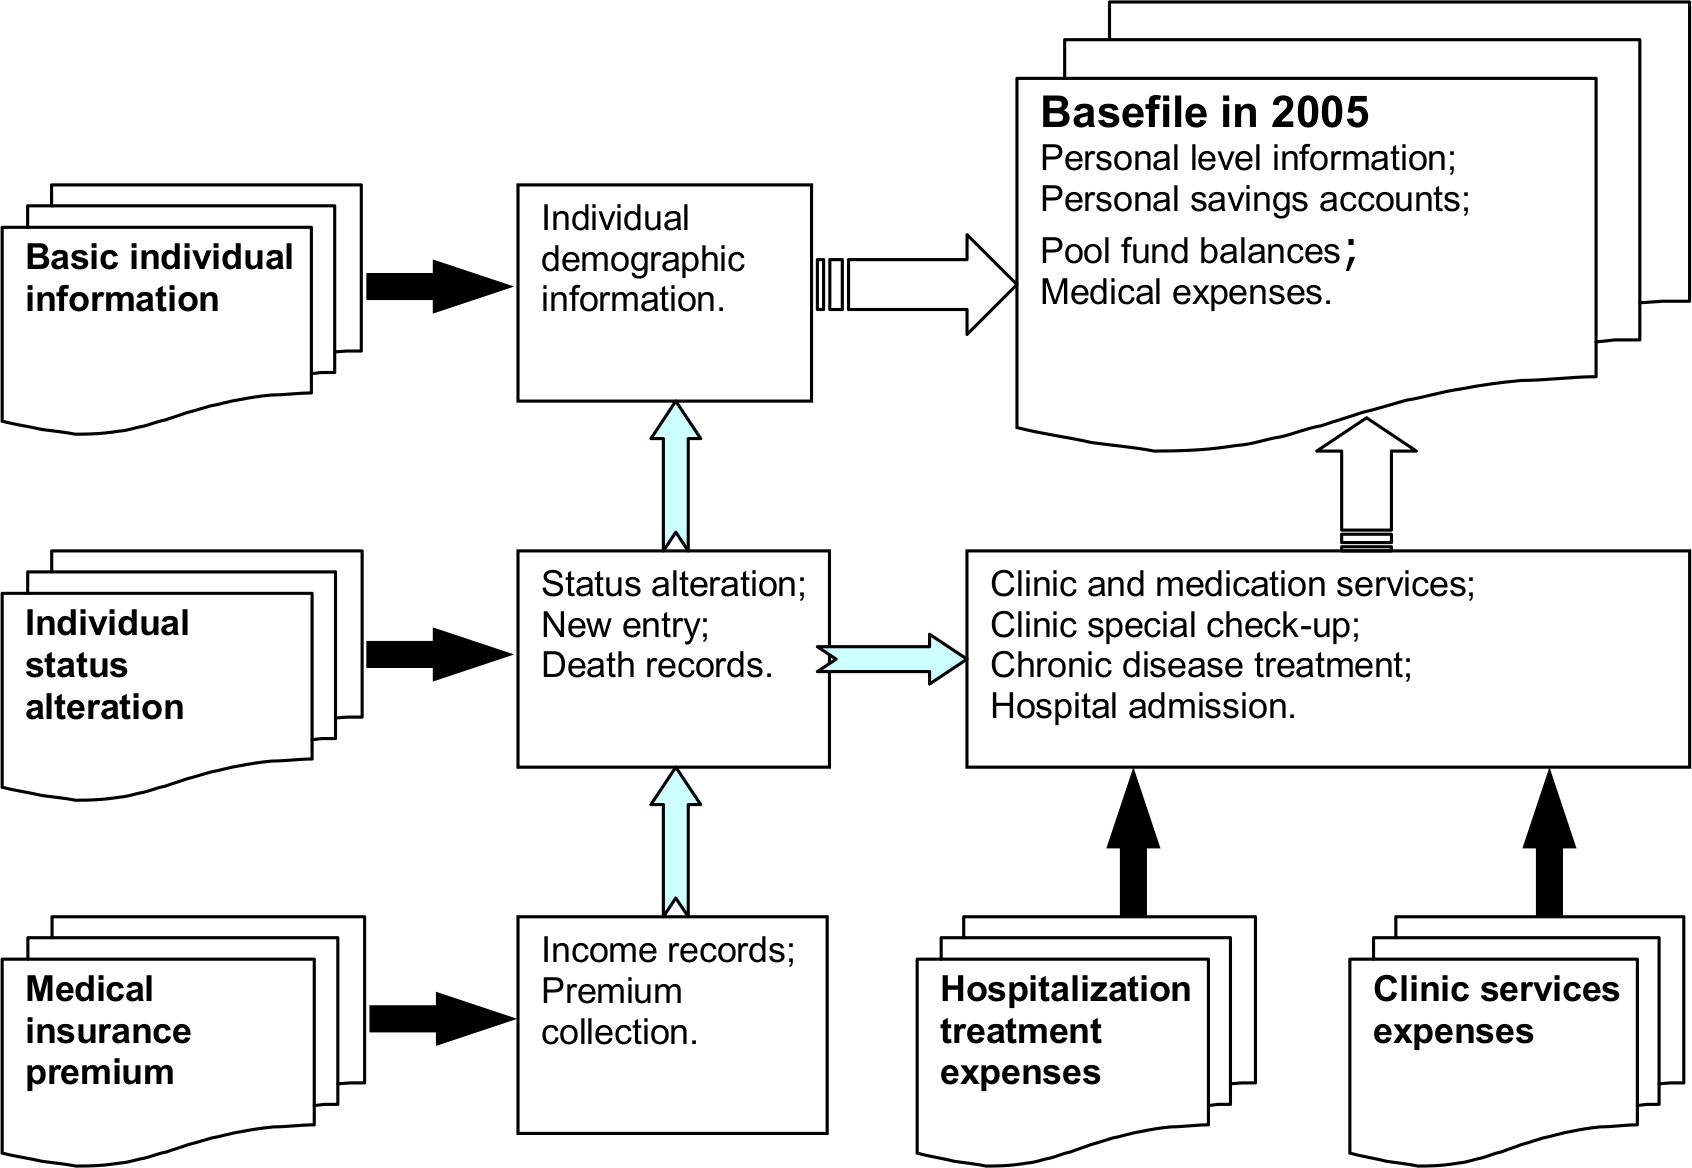
As mentioned in Section 2.2, totally five kinds of medical insurance records for each insured individual were included in the administrative data sources which are outlined in Table 1. The first three kinds of datasets provide the demographic information of medical insurance participants, individual status alteration and insurance premium contribution records, while the other two provide medical expenses information on different types of medical services. The process of using and combining these five kinds of datasets to construct the basefile is outlined in Figure 1.
Administrative datasets used in modelling medical insurance scheme.
| Datasets | Description |
|---|---|
| Basic individual information | Individuals’ basic demographic information under the urban medical insurance scheme over the period of 2001–2005 |
| Individual status alteration | Individual status alteration records of medical insurance scheme participants over the period of 2001–2005 |
| Medical insurance premium | Amount of contributions by individuals and their employers to the basic medical insurance scheme over the period of 2001–2005 |
| Hospitalization treatment expenses | Medical expenditure records of insured participants in both hospitalization and special disease services for the year 2002–2005 |
| Clinic services expenses | Medical expenditure records of clinic services and medications in pharmacies of insured participants over the period of 2001–2005 |

Datasets used in the research and their functions.
The five data sources provided different information on demographic, insurance payment, and medical services. They were connected by the unique personal identifier contained in each dataset. Through combining the five data sets, the main output data for 2005 was produced. This included individual level information plus information on personal savings accounts, pool fund balances and medical expenses. The output, as a basefile in 2005, acts as input data for simulating the medical behaviour of urban employees and retirees under the medical insurance scheme over the period of 2006–2010.
Regarding the corresponding years of these datasets, except for the hospitalization treatment expenses which were provided for the years from 2002 to 2005, the other four datasets were for the period 2001–2005. Due to the incomplete records of the dataset in 2001 and with the advice of the Bureau of Labour and Social Security of Kunming, datasets in 2002–2005 were used regularly when establishing the empirical parameters in modelling the medical insurance scheme.
3. Constructing medical insurance micro datasets
3.1 Medical insurance micro records in 2005
The starting point for the construction of medical insurance micro datasets or base file is the basic information of medical insurance scheme participants at the end of 2005. In the individual basic information datasets, there were 813,801 records registered in the medical insurance scheme in 2005 which included individuals who altered their insurance status in 2005. When constructing the basic individual dataset at the end of 2005, the records of individuals who quit the scheme needed to be removed. This procedure was completed together with the use of the individual status alteration dataset (Table 1) in 2005.
According to the individual status alteration dataset, a total of 359,187 individuals altered their insurance status in 2005, which included new scheme entry, scheme exit, retired and reemployed. The date and type of alteration were picked up according to the date of alteration. It was found that there were 231,189 persons who made a one time alteration, 95,308 persons had a second alteration, and 18,009 had a third alteration and so on. This sort of record detection terminated after 10 times of status alteration which left only 6 remaining records. Then by reversing the procedure 10 times, the scheme status of participants was decided due to their last status alteration. Eliminating the records of individuals who quit the scheme, a dataset having 790,186 individual records was obtained. This dataset did not contain the records of individuals who died in 2005. When estimating the population of insurance participants and analysing the medical expenses in 2005, it is important to consider the individuals who died in the year.
After adding the death records onto the individual information dataset, the number of individual records at the end of 2005 totalled 793,987. This figure was very close to the target population of 794,130 at the end of 2005, which was reported by the Bureau of Labour and Social Security of Kunming (Kunming Medical Insurance Centre 2006). So no further adjustment on the number of the scheme participants was needed. How the number and distribution of death records for the period of 2001–2005 was obtained is discussed later in Section 3.3.
3.2 Age processing and adjustment for insured individiuals
In the created dataset for the year 2005, there were quite a few records which had apparent mistakes about data entry/typing the age of participants. Some employees were under 15 years of age, some employees were above 85 years old but still at work, and some individuals were aged less than 35 years but had already retired. These events are assumed impossible in practice. Such mistakes were therefore checked and revised.
First, for individuals less than the legitimate age of the labour force, there were 118 records with age less than 15 years, some even as young as 7 years old. Such mistakes happened due to typing errors on variables of ‘Date of birth’ or ‘Date of initial job’. The revision procedure first chose the smaller one of these two dates (like suppose the year 1991 is smaller than the year 1996) to be the date of birth of the individual. Together with the use of the variable of ‘Date of entry scheme’, the procedure got a new age variable which was then updated to the end of 2005. This resolved the age problem of 41 records. Next assuming the larger one between ‘Date of birth’ and ‘Date of initial job’ as the individual’s initial job date, the individual’s age was assigned randomly between 15 and 20 years old at the time when they started their initial job. Finally, two records with a date of birth in 2049, which was assumed to be 1949, were adjusted to the age of 56 at the end of 2005.
Second, participants aged over 85 years and were still in the state of employment were assumed impossible in practice. In the original dataset in 2005, 63 individuals were found to be older than 85 years old and were still at work. The legitimate retirement age in China is 60 years for male, 50 years for female employees and 55 years for female government officials. A few individuals can work after the retirement age, but it is very rare to have a job beyond the age of 85 years. The records on the medical insurance premiums indicate that they were employed individuals, and errors occurred in their age. This problem was resolved by randomly making these records have an age between 50 and 80 years.
Third, for the participants aged less than 36 years and were in a state of retirement. In the original individual information dataset in 2005, there were 105 such records. For some reason, such as sickness, some individuals may retire before the legitimate retired age, but not under the age of 36 years. It is supposed there were some typing mistakes about these records. First referring to the variables of ‘Date of birth’ and ‘Date of initial job’, the individual’s age was revised as for individuals less than 15 years old. This resolved the age problem of 40 records. For the remaining 65 records, the revision was achieved by assigning the records arbitrarily an age from 36 to 45 years.
3.3 The death record cases
In the initial individual records, there were no codes indicating the death of the medical insurance participants. However, in the variable of ‘Reason of alteration’, there were some words describing the reason of death, like ‘dead of illness’, ‘dead at accident’, ‘dead on certain day’. By picking up these kinds of words manually and coding them in a new variable, deleting the repeated records due to their personal identifiers, 14,124 death records for the period of 2001–2005 were obtained. The events of the death records are summarised in Table 2. This gives an average annual death rate of 0.5007 per cent over the period of 2002–2005.
Death of medical insurance participants in 2001–2005.
| Year | Number of participants | Number of deaths | Accumulative frequency | Proportion of death (%) |
|---|---|---|---|---|
| 2001 | 3,77,676 | 291 | 291 | 0.0771 |
| 2002 | 5,32,706 | 2,373 | 2,664 | 0.4455 |
| 2003 | 6,61,038 | 3,573 | 6,237 | 0.5405 |
| 2004 | 7,56,996 | 3,823 | 10,060 | 0.5050 |
| 2005 | 7,93,987 | 4,064 | 14,124 | 0.5118 |
In addition to the total information on death, the death rates by gender across age group were calculated (Tables 3 and 4). Because of incomplete death information in 2001, due to the first year commencement of the scheme, the death rates by gender across age group in 2001 were quite different from the other four years (similar in Table 2). In forecasting personal medical behaviour and medical insurance policies over the period of 2006–2010, the average death rates over 2002–2005 will be used to project the death events. On average, the death rate is about 6.28 for male and 3.52 for female. The death rate of males was 1.78 times higher than the counterpart of females.
Age group specific death number and death rate (0.1%) of male (2001–2005).
| Year | ≤ 34 | 35–49 | 50–64 | ≥ 65 | Total number | ≤ 34 | 35–49 | 50–64 | ≥ 65 | Total rate |
|---|---|---|---|---|---|---|---|---|---|---|
| 2001 | 4 | 16 | 47 | 127 | 194 | 0.0804 | 0.2543 | 0.8673 | 4.3571 | 0.9899 |
| 2002 | 35 | 99 | 374 | 1,095 | 1,603 | 0.5003 | 1.0766 | 4.4636 | 23.1903 | 5.4724 |
| 2003 | 43 | 152 | 525 | 1,653 | 2,373 | 0.5057 | 1.3631 | 5.0157 | 27.3214 | 6.5605 |
| 2004 | 66 | 178 | 612 | 1,808 | 2,664 | 0.6881 | 1.4875 | 5.2957 | 27.7599 | 6.7226 |
| 2005 | 60 | 195 | 761 | 1,725 | 2,741 | 0.5678 | 1.5188 | 6.1504 | 23.6195 | 6.3623 |
| Average death rate over 2002–2005 (0.1%) | 0.5655 | 1.3615 | 5.2314 | 25.4728 | 6.2795 | |||||
Age group death number and death rate (0.1%) of female (2001–2005).
| Year | ≤ 34 | 35–49 | 50–64 | ≥ 65 | Total number | ≤ 34 | 35–49 | 50–64 | ≥ 65 | Total rate |
|---|---|---|---|---|---|---|---|---|---|---|
| 2001 | 2 | 11 | 23 | 61 | 97 | 0.0431 | 0.2008 | 0.4777 | 3.0511 | 0.5728 |
| 2002 | 16 | 57 | 160 | 537 | 770 | 0.2545 | 0.6833 | 2.2372 | 17.0563 | 3.0886 |
| 2003 | 29 | 77 | 248 | 846 | 1,200 | 0.3892 | 0.7402 | 2.8507 | 20.7135 | 3.9168 |
| 2004 | 21 | 82 | 256 | 800 | 1,159 | 0.2527 | 0.7132 | 2.7311 | 17.7054 | 3.4392 |
| 2005 | 21 | 83 | 335 | 884 | 1,323 | 0.2312 | 0.6878 | 3.3030 | 17.6004 | 3.6430 |
| Average death rate over 2002–2005 (0.1%) | 0.2819 | 0.7061 | 2.7805 | 18.2689 | 3.5219 | |||||
3.4 Add personal income information
After completing the construction of the 2005 basic individual information dataset, personal income information was added to this dataset. The average monthly income for each participant was added annually referring to the datasets of collecting insurance premiums.
In determining the income information for each person, the frequency distribution of monthly premium payment for each year was analysed. Reversing from 2005 to 2001, the number of months per person for premium payment in each year was determined according to individual’s entry date to the medical insurance scheme. Table 5 illustrates the records of the monthly premium payments and monthly income by age group in 2005. In 2005, there were total of 793,987 participants, of which 777,117 had payment records, giving the payment rate of 97.88 per cent. Here the age group was classified into five categories, three age categories for employees in accordance with the age classification under the medical insurance scheme and two age categories for retirees.
Monthly premium information by age group in 2005.
| Age group | Number of participants | Number of participants with payment | Payment rate (%) | Average monthly income (Yuan) | Minimum income (Yuan) | Maximum income (Yuan) |
|---|---|---|---|---|---|---|
| Emp ≤ 34 years | 1,96,410 | 1,89,614 | 96.54 | 1,176 | 450 | 3,342 |
| Emp 35–49 | 2,43,227 | 2,40,111 | 98.72 | 1,249 | 468 | 3,342 |
| Emp ≥ 50 years | 91,893 | 91,424 | 99.49 | 1,179 | 336 | 3,342 |
| Ret ≤ 64 years | 139,362 | 137,544 | 98.70 | 763 | 111 | 3,320 |
| Ret ≥ 65 years | 1,23,095 | 1,18,424 | 96.21 | 760 | 108 | 3108 |
| Total | 7,93,987 | 7,77,117 | 97.88 |
-
Note: Emp – Employee, Ret – Retiree
Table 6 presents the payment distribution of number of months to the scheme in 2005. The figure ‘99’ in the first column means records with missing monthly income. Two adjustments need to be carried out for these income missing records, one is to compensate for the income, the other is to determine how many months the individual paid the premium in that year. The monthly income of these missing records was imputed by randomly picking up the records with known income by gender across age group. The number of months for premium payment for the missing income records was determined by the date of their scheme entering. Table 7 presents the result after the compensation for the income missing records. Comparing the income on average, minimum and maximum with Table 5, the results are good and reasonable.
Distribution of number of monthly payments to the scheme in 2005.
| Number of months | Participant frequency | Percentage | Accumulative frequency | Accumulative percentage |
|---|---|---|---|---|
| 1 | 5,576 | 0.70 | 5576 | 0.70 |
| 2 | 4,545 | 0.57 | 10,121 | 1.27 |
| 3 | 6,211 | 0.78 | 16,332 | 2.06 |
| 4 | 5,309 | 0.67 | 21,641 | 2.73 |
| 5 | 4,417 | 0.56 | 26,058 | 3.28 |
| 6 | 4,856 | 0.61 | 30,914 | 3.89 |
| 7 | 4,816 | 0.61 | 35,730 | 4.50 |
| 8 | 9,043 | 1.14 | 44,773 | 5.64 |
| 9 | 4,597 | 0.58 | 49,370 | 6.22 |
| 10 | 5,506 | 0.69 | 54,876 | 6.91 |
| 11 | 12,472 | 1.57 | 67,348 | 8.48 |
| 12 | 709,769 | 89.39 | 777,117 | 97.88 |
| 99 | 16,870 | 2.12 | 793,987 | 100.00 |
-
Note: ’99 in the first column indicates missing records.
The monthly income by age group in 2005 after imputation.
| Age group | Actual population | Population after imputation | Average income (Yuan) | Minimum income (Yuan) | Maximum income (Yuan) |
|---|---|---|---|---|---|
| Emp ≤34 years | 1,96,410 | 1,96,410 | 1,175.67 | 450.00 | 3,342.25 |
| Emp 35–49 years | 2,43,227 | 243,227 | 1,249.58 | 468.25 | 3,342.25 |
| Emp ≥50 years | 91,893 | 91,893 | 1,179.26 | 336.00 | 3,342.25 |
| Ret ≤64 years | 1,39,362 | 1,39,362 | 763.59 | 111.00 | 3,319.71 |
| Ret ≥65 years | 1,23,095 | 1,23,095 | 760.58 | 108.00 | 3,107.50 |
| Total | 7,93,987 | 7,93,987 |
-
Note: Emp – Employee, Ret – Retiree.
Similarly, the missing values of income were imputed for each year of 2002–2004, of which the number of payment months for each individual in 2002 was doubled due to only the information at the first half of that year was provided. Regarding the year 2001, it was not possible to do the same compensation to estimate the income for individuals without income records because of very high income missing rate (83.5%). This problem was solved by using estimated adjustment coefficients through linear fitting incomes of 2002–2005 across each age group. That is, the income in 2001 was estimated by using linear regression methods.
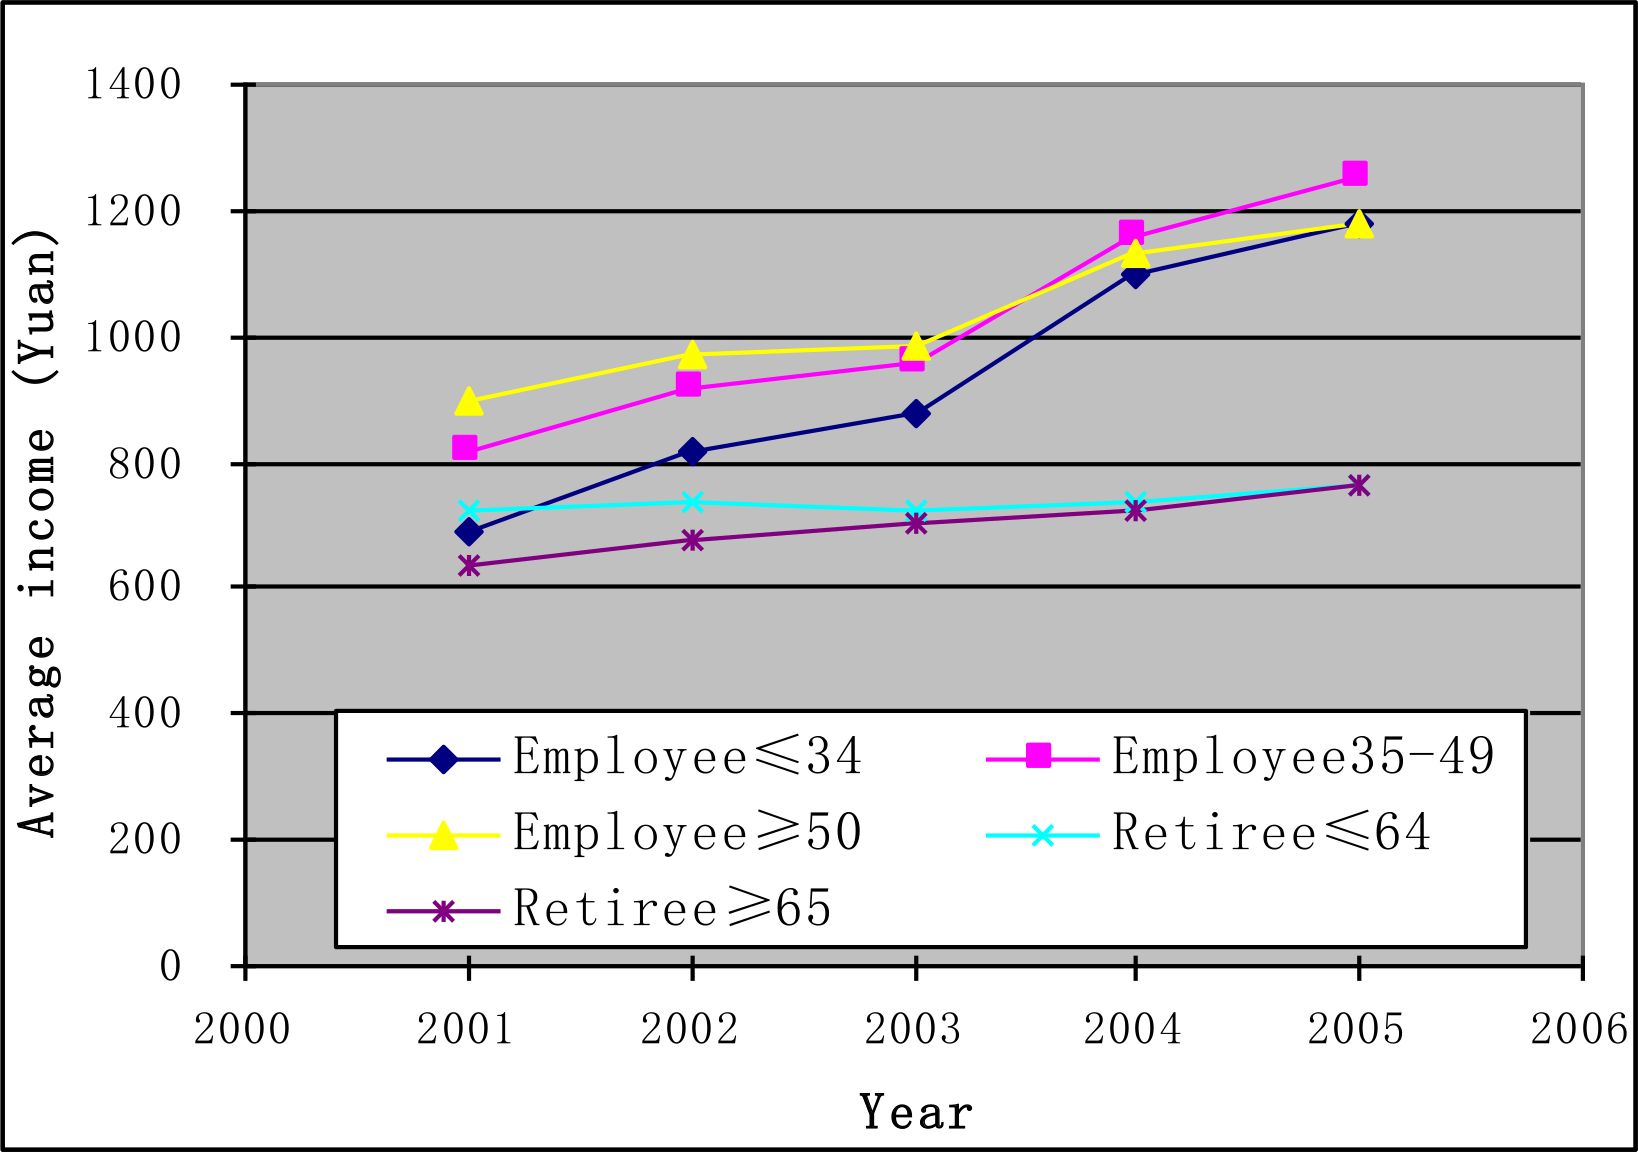
Figure 2 gives the average income trends over the period of 2001–2005. On average, the income of all age groups showed increasing trends. However, both the amount and growth rate for each group of employees are bigger than those for the two groups of retirees. The income of retirees only showed a slight increase. The income gap between employees and retirees was broadened during this period. This, as a result, leads to low balances of the personal savings accounts for retirees.
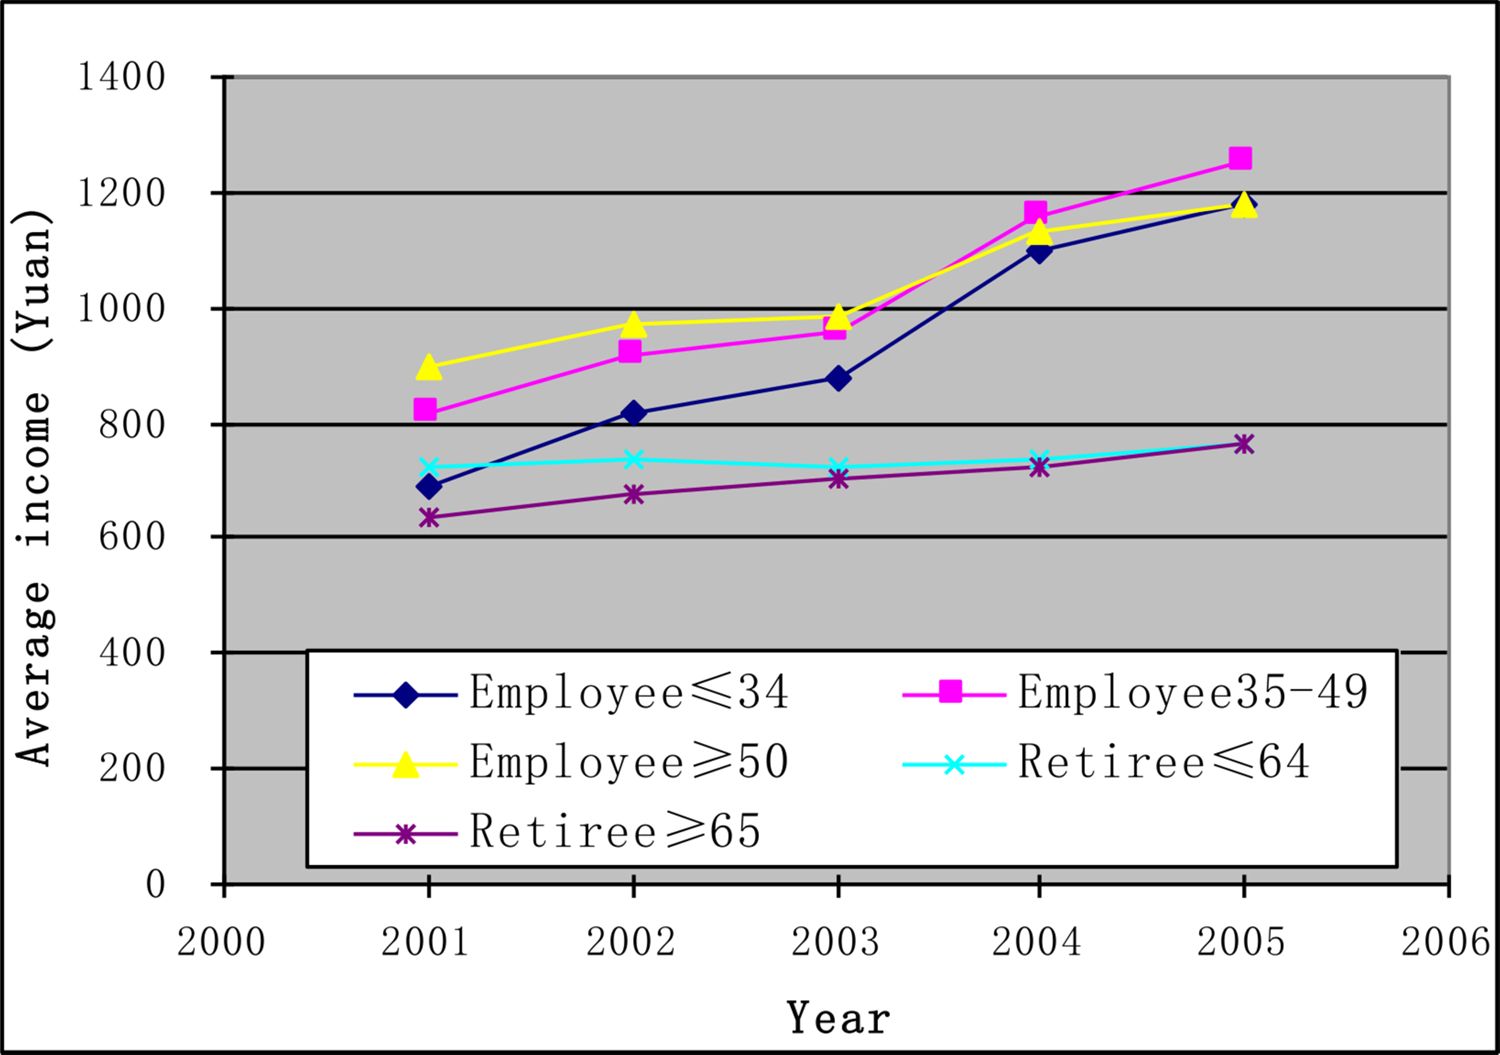
The income trends of 2001–2005 by age group.
3.5 Set up personal savings accounts
After fixing monthly income, a variable representing the personal savings account was created for each individual across five different age groups. This was done according to the allocation premium rules for each age group under the medical insurance scheme. Table 8 shows the cumulative amount in personal savings accounts (accumulated from the commencement of entering the scheme) by age groups at the end of 2005. The group of employees aged 50 years and over got the highest average accumulative amount (1989 Yuan) in their personal savings accounts, while the group of employees aged less than 35 years the lowest. The accumulative amounts of the personal savings accounts varied significantly among individuals, with some as high as more than 7000 Yuan (retirees aged 65 years or over), while the others as low as 28 Yuan (retirees aged less than 65 years). Totally, there were 5,660 individuals whose personal savings accounts had cumulative deposits less than 100 Yuan. This was due to their short time period of entering the medical insurance scheme and their low monthly income which was under 1000 Yuan.
The accumulative amount in personal savings accounts at the end of 2005 (Yuan).
| Age group | Population | Average accumulate | Standard deviation | Minimum | Maximum |
|---|---|---|---|---|---|
| Emp ≤ 34 years | 1,96,410 | 1,116 | 754 | 69 | 5,014 |
| Emp 35–49 years | 2,43,227 | 1,698 | 900 | 69 | 5,758 |
| Emp≥50 years | 91,893 | 1,989 | 1,033 | 39 | 6,484 |
| Ret ≤64 years | 1,39,362 | 1,402 | 766 | 28 | 6,382 |
| Ret ≥65 years | 1,23,095 | 1,385 | 714 | 35 | 7,257 |
| Total | 7,93,987 |
-
Notes: Emp – Employee,Ret – Retiree.
3.6 Determine government officials
A Government official fund has been established along with the commencement of the basic medical insurance system in Kunming in April 2001, which is financed by the local governments. Apart from the benefits from the social pool fund when medical services are needed, government officials further can get benefits from the Government official fund. There was no variable in the original datasets indicating which records belong to government officials. So it was necessary to determine the population of government officials.
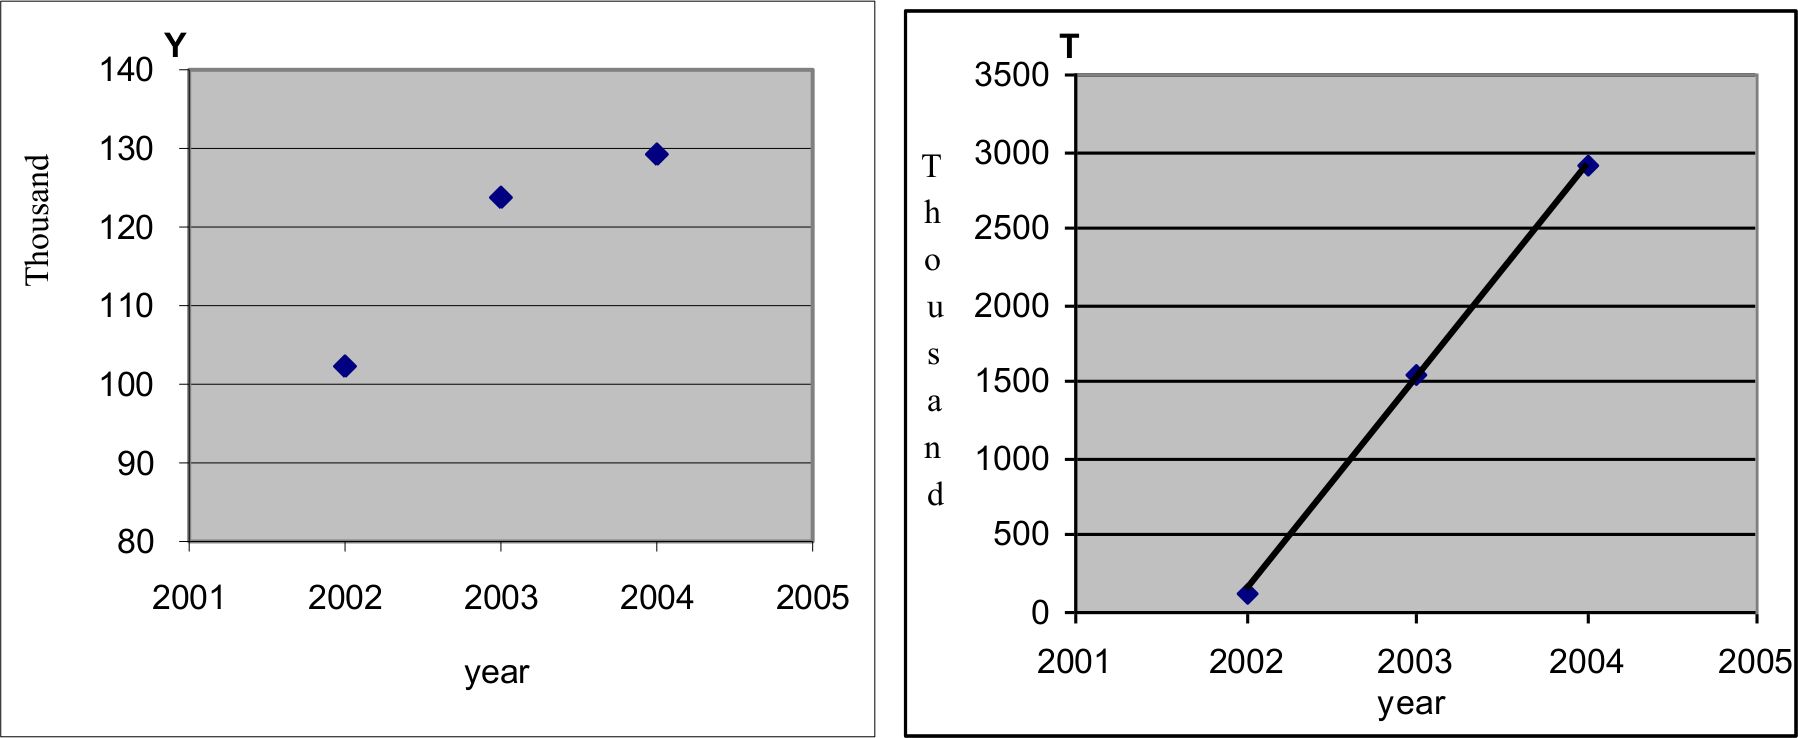
First, it was necessary to determine the number of government officials in 2005 and the forecasting years of 2006–2010. Referring to the medical insurance implementation report for the year of 2001–2004 by Kunming (the Bureau of Labour and Social Security 2005), the number of government officials in 2005 was estimated. Broadly, according to the actual number of officials over the period of 2002–2004, curve fitting (Figure 3) was conducted and the number of officials for each year of 2005–2010 was estimated (Table 9).

Exponential curve fitting for estimating the number of officials.
Estimation of number of officials using exponential curve fitting.
| Year | Actual number of officials | Estimated number of officials | Relative errors* | Estimated number of participants | % of officials to participants |
|---|---|---|---|---|---|
| 2002 | 1,02,310 | 1,02,873 | 0.5503 | 577,066 | 17.8 |
| 2003 | 123,769 | 123,670 | −0.0800 | 683,646 | 18.1 |
| 2004 | 1,29,259 | 1,29,285 | 0.0201 | 747,710 | 17.3 |
| 2005 | 1,32,667 | 7,93,663 | 16.7 | ||
| 2006 | 1,35,096 | 8,29,518 | 16.3 | ||
| 2007 | 1,36,991 | 8,58,925 | 15.9 | ||
| 2008 | 1,38,546 | 8,83,852 | 15.7 | ||
| 2009 | 1,39,865 | 9,05,486 | 15.4 | ||
| 2010 | 1,41,009 | 9,24,596 | 15.3 | ||
| Fitted R2 | 0.9999 |
-
Note: *Relative Errors = (Estimated – Actual)/Actual × 100.
In detail for the curve fitting, the scatter plot of the number of officials (Y) versus year (left side in Figure 3) shows an exponential curve trend. A new variable T was derived by transforming Y with an equation of T = 10Y/20000. Choosing the number 20,000 was to use the linear regression method to fit a straight line of this new variable T versus year. The estimate function of T could be obtained as,
So reversing the variable T to the number of officials Y, the estimates of Y can be expressed as the following equation.
Using this estimated equation, the number of government officials for each year of 2005–2010 could be obtained, with the results shown in Table 9. The R square of the curve fitting was high at 0.9999. The comparison between the actual number and estimated number for the years of 2002–2004 was very close. Table 9 also presents the estimated number of scheme participants (Xiong et al. 2007) and the trend in the proportion of officials in the participant population.
The next step was to determine the records of the government officials. By Table 9, the estimated number of the officials in 2005 was 132,667. Some clues of government officials could be found in the raw datasets of hospitalization services. By checking the medical expenditure records in 2002–2005, records with expenses subsidized by the Government official fund were allocated to be government officials. This process determined a total number of 26,955 records as officials. Then referring to the dataset of individual basic information in 2005, 105,604 records with a code of ‘Cadre’ in a variable ‘Personal status’ were treated as officials (Table 10). Excluded those records with expenses subsidized by the Government official fund, an extra 86,823 records were picked up to be officials. The above two processes gave a total number of 113,778 officials. The remaining 18,889 officials in 2005 needed to be imputed. This was done by using discriminant analysis to identify the government officials in 2005.
The distribution of personal status in 2005.
| Variable | Category | Frequency | Percentage | Accumulative frequency |
|---|---|---|---|---|
| Personal status | Cadre | 1,05,604 | 14.33 | 1,13,778 |
| Worker | 76,308 | 9.90 | 1,92,403 | |
| Farmer labourer | 137 | 0.02 | 1,92,601 | |
| Missing | 6,01,386 | 75.74 | 7,93,987 |
The following steps were undertaken to identify government officials.
In the created basefile for 2005, there were mainly two categories in a variable ‘Personal status’ – Cadre or Worker, with only 0.02 per cent of records indicated as ‘Farmer labourer’ and a large frequency (75.74 per cent) as missing records (Table 10).
For the records with identified personal status of ‘Cadre’ or ‘Worker’, the binary discriminant analysis was conducted to create the discriminant functions (Armitage et al. 2002). In this process, eight possible impact factors were considered: Gender, Nationality, Employment status, Education degree, Marital status, Age group, Age and Monthly income (Table 11).
Here the age group follows the classification of the medical insurance scheme, three age groups for employees and two age groups for retirees. The first six factors are categorical variables, while the other two factors are continuous variables. Getting rid of the missing records among these factors, left 763,215 records which accounted for 96.12 per cent of the total records.
For the identified population of ‘Cadre’ and ‘Worker’, which had 192,403 records (Table 10), the binary discriminant functions were created by stepwise discriminant analysis to distinguish officials (Cadres) and workers. The constant items and coefficients of the linear discriminant functions are given in Table 12.
The result of the binary discriminant analysis showed that all eight considered factors had significant impact on the classification between officials and workers. The corresponding partial R-Square indicated that ‘Education degree’ was the most important impact factor, followed by Age, Marital status and Monthly income (Table 12). The other four factors of Gender, Nationality, Employment status and Age group had less impacts on the classification compared with the first four factors.
Retrospective testing using the above linear discriminant functions indicates that the classification error was 28.62 per cent for ‘Official’, 25.08 per cent for ‘Worker’, giving the total error of 27.13 per cent (less than 30 per cent, Table 13). The classification result was reasonable and acceptable.
For the 601,386 records with no personal status (or missing, the last row in Table 10), the above linear discriminant functions were adopted to estimate who could be potential officials. As a result, 240,280 individual records were classified into potential officials. Finally, by using simple random sampling method, 18,889 individuals were picked up randomly from these potential officials and were made to be government officials. Plus the above determined number of 113,778 officials, that would make the expected number of officials 132,667 in 2005 (Table 9). Thus, the problem of identifying the records of the government officials in 2005 was resolved.
The impact factors of discriminant analysis in identifying officials.
| Factors | Category | Frequency | percentage | Accumulative frequency |
|---|---|---|---|---|
| Gender | Male | 4,16,632 | 54.59 | 4,16,632 |
| Female | 3,46,583 | 45.41 | 7,63,215 | |
| Nationality | Han | 6,98,678 | 91.54 | 6,98,678 |
| Minorities | 64,537 | 8.46 | 7,63,215 | |
| Employment status | Employee | 5,08,400 | 66.61 | 5,08,400 |
| Retiree | 2,54,815 | 33.39 | 7,63,215 | |
| Education degree | Under primary | 1,50,333 | 19.70 | 1,50,333 |
| Junior high school | 1,81,643 | 23.80 | 3,31,976 | |
| Senior high school | 2,45,124 | 32.12 | 5,77,100 | |
| University | 1,86,115 | 24.39 | 7,63,215 | |
| Marital status | Single | 1,75,146 | 22.95 | 1,75,146 |
| Married | 5,88,069 | 77.05 | 7,63,215 | |
| Age group | Employee ≤34 years | 1,87,106 | 24.52 | 1,87,106 |
| Employee 35–49 years | 2,32,154 | 30.42 | 4,19,260 | |
| Employee ≥50 years | 89,140 | 11.68 | 5,08,400 | |
| Retiree ≤64 years | 1,35,959 | 17.81 | 6,44,359 | |
| Retiree ≥65 years | 1,18,856 | 15.57 | 7,63,215 | |
| Age | Continuous variable | 7,63,215 | ||
| Monthly income | Continuous variable | 7,63,215 |
Constants and Coefficients of discriminant functions.
| Classify | Constant | Gender | Nationality | Employment | Education | Marry | Age |
|---|---|---|---|---|---|---|---|
| Official | −54.3071 | 6.16945 | 14.2724 | 25.45331 | 6.1558 | 5.37318 | 1.39241 |
| Worker | −48.8466 | 6.20641 | 14.15723 | 25.34738 | 4.69624 | 5.83103 | 1.36205 |
| Partial R-Square | 0.0001 | 0.0002 | 0.0001 | 0.2277 | 0.0063 | 0.0335 |
Number of Observations and Percent Classified into Cadre or Worker.
| Original classification | Classified into Official | Classified into Worker | Total |
|---|---|---|---|
| Official No | 75,451 | 30,153 | 1,05,604 |
| % | 71.38 | 28.62 | 100.00 |
| Worker No | 19,206 | 57,102 | 76,308 |
| % | 25.08 | 74.92 | 100.00 |
| Total No | 94,657 | 87,255 | 1,81,912 |
| % | 51.96 | 48.04 | 100.00 |
For the government officials in the following years of 2006–2010, which are estimated to have a small growth in the number of the population (Table 9), the method of simplified random picking up would be used to determine the officials instead of using the discriminant analysis again.
After identifying the records of government officials, a certain percentage of their income was allocated to their personal savings accounts according to the relative supplementary policy. After subsidizing their personal savings accounts, merging with the amount of allocation regulated by the medical insurance scheme, the final personal savings accounts for officials were established. So government officials’ personal savings accounts consisted of two monetary parts; one comes from the income allocation under the medical insurance scheme, the other comes from the financial assistance by the local governments.
3.7 Settle the balance of personal savings accounts
This subsection describes the addition of the information on medical expenses to each individual’s basic information records each year. The total medical expenses for individuals are covered jointly by the personal savings accounts or patients themselves, the social pool fund, the serious illness fund, and the Government official fund for officials. The medical expenses paid by participants themselves include the following four items.
Total self payments.
These payments are for medical services not covered by the basic medical insurance scheme. Individuals need to pay all the costs of these kinds of services through out of pocket payments.
Payments for clinic treatments and medication in pharmacies
These two kinds of medical expenditure should be paid through personal savings accounts. When the personal savings accounts are exhausted, patients should pay the excess fees directly from their own pockets.
Shared payments for hospitalisation and special diseases
These payments include threshold fees admitted to a hospital, amount of shared percentage for hospitalisation services (small part, around 10 per cent of the cost), individual shared payment for special diseases and emergency services in clinic. These kinds of payments can be charged to the personal savings accounts or individuals concerned directly.
Self payments for special clinic checkup and chronic disease
Usually 20–30 per cent of these kinds of expenses are shared by individuals, the rest of expenses are covered by the social pool fund. These kinds of expenses shared by individuals can be charged to the personal savings accounts or individuals concerned directly.
After finishing the calculation of these four items of medical expenses in 2001–2005, all of the expenses were summed up to get the total medical services cost shared by individuals. Deducting these medical services costs from the personal savings accounts, then the balances of the personal savings accounts for each person were obtained. Here for the personal savings accounts which are managed by individuals themselves, the balances equal the accumulative amounts minus the medical services costs payable by individuals concerned.
Except the total self payment and the payments by the personal savings account, the rest of the medical expenses are covered jointly by the social pool fund, the serious illness fund and the Government official fund. Table 14 presents the average results of different kinds of costs for each age group, and the accumulative amounts and balances of the personal savings accounts in average. Here the personal savings accounts covered all the costs shared by individuals except for the medical services items out of the medical insurance scheme, which were totally paid by individuals themselves.
Different kind of costs in average by age group at the end of 2005 (Yuan).
| Age group | Average Payment for each insured individual by | Amount of Accumulate in PSA | Balance of PSA | ||||
|---|---|---|---|---|---|---|---|
| Self Totally | Personal savings account | Social pool fund | Serious illness fund | Government official fund | |||
| Emp ≤34 years | 22 | 1,050 | 283 | 19 | 3 | 1,607 | 557 |
| Emp 35–49 years | 49 | 1,640 | 724 | 47 | 9 | 2,226 | 586 |
| Emp ≥50 years | 81 | 1,977 | 1,361 | 126 | 12 | 2,477 | 501 |
| Ret ≤64 years | 130 | 1,961 | 2,687 | 187 | 9 | 1,639 | −322 |
| Ret ≥65 years | 223 | 2,578 | 5,025 | 313 | 23 | 1,614 | −964 |
-
Note: Emp – Employee, Ret – Retiree, PSA – Personal savings account
On average, the personal savings accounts of employees could cover all the medical services costs shared by individuals with some balances. However, for retirees, especially for retirees aged 65 years and over, the balances of their personal savings accounts were negative. Regarding retirees, the older the individuals, the larger the gap to cover the medical treatment fees which supposed to be paid by individuals themselves.
3.8 Income adjustment parameters
When forecasting individual’s medical expenditure and assessing the medical insurance scheme, the individual’s income plays an important role because both the social pool fund and the personal savings account are collected with the premium based on the individual’s income. So after creating the basic individual information dataset for the forecasting year, the income adjustment parameters for different age groups of individuals need to be established.
The income increase parameters (or adjustment parameters) of the participants were obtained using the income information from 2002 to 2005. It is assumed that individual’s monthly income remains unchanged in the particular forecasting year. The adjustment parameters were constructed by the following three steps.
First, by categories of gender across age group, the incomes were split into several sections. The actual data analysis of 2002–2005 shows that the higher the income, the more variation occurs, so more classes should be used to catch the variation. As a result, the individual monthly income in each year of 2002–2004 were split into 9 classes according to income percentile, that is, Minimum-P5 (the fifth percentile of income, similar for the others), P5-P10, P10-P25, P25-P50, P50-P75, P75-P90, P90-P95, P95-P99, P99-Maximum. So the individual income was categorized into 2×5×9 = 90 groups, where 2 represents male and female, and 5 represents 5 age groups.
Second, for each of the above categorized 90 income groups, increase rates of individual income were calculated for 2002–2003, 2003–2004 and 2004–2005. These rates of increase for each income group were further divided into 8 segments from the lowest to the highest, in detail, Lowest-P10 (the tenth percentile of income), P10-P25, P25-P50, P50-P75, P75-P90, P90-P95, P95-P99, P99-Highest. In this way, 90×8 = 720 income cells were obtained. By the actual calculation, the rates of increase in those income cells for three different years of 2002–2003, 2003–2004 and 2004–2005 showed consistent trends.
Third, in each income cell, the average rates of increase of the three years in a row were calculated. Such calculations were reasonable because the income cells stood for the same percentiles and had consistent trends for the above three different years. The results are illustrated in Table 15, where the first column indicates gender of male and female, the second column indicates 5 age groups, and the third column indicates 9 income sections in percentile. Rate1 – Rate8 at the first row means the different rates of increase, with the relative interval of frequency at the last row.
The monthly income adjustment parameters.
| Sex | Group | Income | Rate1 | Rate2 | Rate3 | Rate4 | Rate5 | Rate6 | Rate7 | Rate8 |
|---|---|---|---|---|---|---|---|---|---|---|
| 1 | 1 | 1 | 0.12266 | 0.14138 | 0.21787 | 0.47927 | 1.04961 | 1.73501 | 3.31952 | 4.66841 |
| 1 | 1 | 2 | 0.08690 | 0.11716 | 0.20500 | 0.42003 | 0.87130 | 1.47540 | 3.00536 | 4.31932 |
| 1 | 1 | 3 | −0.00323 | 0.06362 | 0.13608 | 0.39481 | 0.81915 | 1.47868 | 2.85378 | 4.02337 |
| 1 | 1 | 4 | −0.18203 | −0.03832 | 0.03729 | 0.22041 | 0.49273 | 0.95651 | 2.01142 | 3.10143 |
| 1 | 1 | 5 | −0.36013 | −0.16767 | 0.01439 | 0.11296 | 0.30066 | 0.65700 | 1.38539 | 2.07747 |
| 1 | 1 | 6 | −0.48373 | −0.28098 | −0.04153 | 0.08365 | 0.28106 | 0.52561 | 1.04572 | 1.53034 |
| 1 | 1 | 7 | −0.61252 | −0.42016 | −0.15020 | 0.06411 | 0.25603 | 0.45087 | 0.66346 | 0.89255 |
| 1 | 1 | 8 | −0.69212 | −0.49179 | −0.18298 | 0.05357 | 0.18571 | 0.27947 | 0.36918 | 0.47154 |
| 1 | 1 | 9 | −0.70124 | −0.45743 | −0.20916 | 0.00736 | 0.02508 | 0.02691 | 0.00249 | 0.15586 |
| 1 | 2 | 1 | 0.09254 | 0.14038 | 0.21973 | 0.50458 | 1.17240 | 1.93866 | 3.50962 | 4.69382 |
| 1 | 2 | 2 | 0.04557 | 0.08680 | 0.15186 | 0.43602 | 0.99369 | 1.67413 | 2.98944 | 4.24908 |
| : | : | : | : | : | : | : | : | : | : | |
| 2 | 5 | 8 | −0.60547 | −0.41587 | −0.00792 | 0.03741 | 0.06543 | 0.11838 | 0.17226 | 0.27425 |
| 2 | 5 | 9 | −0.68014 | −0.47035 | −0.16917 | 0.02955 | 0.05355 | 0.10269 | 0.13050 | 0.18214 |
| Relative frequency | 0–0.10 | 0.10–0.25 | 0.25–0.50 | 0.50–0.75 | 0.75–0.90 | 0.90–0.95 | 0.95–0.99 | 0.99–1.00 | ||
With the parameters of monthly income rates of increase in Table 15, each individual’s monthly income in 2006–2010 can be projected. For example, for a male in age group 1 (employee aged less than 35 years), if his monthly wage fell into the lowest section (Income = ‘1’), then his monthly wage in the coming year would have an increase rate of 0.12266 with a chance of 10 per cent (refer to the relative frequency in the last row in Table 15). In practice, a uniform random number was given to this person. If this person’s random number fell into 0≤random<0.10, then his monthly income would have an increase rate Apart from the basic medical insurance scheme, of 0.12266. Such income adjustment was carried Kunming has also established a government out once a year in the model.
4. Discussions
This article discusses part of a microsimulation model developed to assess the distributional impacts of medical insurance policies in the city of Kunming and describes an important step of the development of the model. Through the overview of the medical insurance scheme of China’s urban employees and employers, the article describes in detail the steps to create the basefile.
Using the administrative microdata sources over the period of 2001–2005 provided by the Bureau of Labour and Social Security of Kunming, the basefile was constructed for the microsimulation model for the medical insurance scheme in China. The basefile, for the year 2005, mainly contains demographic information of medical insurance participants. The determined population of participants in 2005 was quite close to the target population reported by the Bureau of Labour and Social Security of Kunming (Kunming Medical Insurance Centre 2006). The death rates by gender across age group were created manually, which is vital information for projecting medical expenses.
Monthly income was imputed for individual records with missing income values using Monte Carlo method and linear curve fitting. Using this information, the personal savings account for each individual was created. Combining with the calculated different medical expenses, the balance of the personal savings account was achieved. On average, by the end of 2005, the personal savings accounts of employees could cover all the medical expenses shared by individuals with some balances. However, for retirees, especially for retirees aged 65 years and over, there were large gaps to cover the medical treatment fees with their personal savings accounts.
Apart from the basic medical insurance scheme, Kunming has also established a government official fund for the government officials. Unfortunately the information about government officials in the raw datasets was quite insufficient. The project used the combination methods of logarithm curve fitting and binary discriminant analysis to identify government officials. The results were reasonable and acceptable. For comparison, the estimated total number of medical insurance participants over 2006–2010 was also presented. This showed a steady growth trend. Because of a new medical reform plan announced by China’s State Council in April 2009 (Lan et al. 2009), it is estimated that more young employees would join the medical insurance scheme.
Finally, the income adjustment parameters for medical insurance participants were produced by using the income information from 2002 to 2005. When forecasting the medical insurance scheme for the coming years 2006–2010, these parameters will be very important information. With these parameters, individuals’ income would be adjusted annually, on which the medical insurance premium contribution would be collected according to the relative medical insurance policies.
Based on the basefile constructed as discussed in this article, a static microsimulation model could be built to assess the implementation effects of the medical insurance policies and analyse the impact of the urban medical insurance system on urban employees and employers. By analysing the balances of the social pool fund, the serious illness fund and the Government official fund at the end of each forecast year, the assistance capacity and sustainable development of these pool funds could be examined. For example, it could estimate the payment proportion covered annually by the social pool fund and the serious illness fund together for the total incurred medical costs over the period of 2006–2010. It could also project the distribution of personal saving accounts and the medical services burden for different age groups of the population.
References
- 1
-
2
Moving towards an improved microsimulation model of the Australian Pharmaceutical Benefits SchemeAustralian Economic Review 37:41–61.
-
3
Green book of Medical and Health Services: The Government should take more responsibility for unsuccessful of medical insurance reformGreen book of Medical and Health Services: The Government should take more responsibility for unsuccessful of medical insurance reform, Chinese Youth Newspaper, 23, May, www.thdb.com/show.aspx?id=178&cid=16.
-
4
China’s Reform of the Medical and Health SystemChina’s Reform of the Medical and Health System, July, http://www.bhih.com/html/2005/08/2005080 1090346.shtml.
-
5
Building Policy-Relevant Health Human Resource ModelsIn: A. Gupta, A Harding, editors. Modelling Our Future: Population Ageing, Health and Aged Care. North-Holland, Amsterdam: International Symposia in Economic Theory and Economitrics. pp. 322–342.
-
6
Modelling Our Future: Population Ageing, Social Security and TaxationNorth-Holland, Amsterdam: International Symposia in Economic Theory and Economitrics.
-
7
Kunming basic medical insurance: guideline for insurance participants (in Chinese)Kunming, China: Yunnan Nationality Press.
-
8
Implement analysis report on Kunming’s medical insurance system for the year of 2005 (in Chinese)Kunming: China.
-
9
Statistical announcement on labour and social security issues in 2006Ministry of Labour and Social Security and Bureau of National Statistics.
-
10
A long and winding road to recovery, China Daily, 2009-04-28A long and winding road to recovery, China Daily, 2009-04-28, http://www.chinadaily.com.cn/cndy/2009-04/28/content_7722153.htm.
-
11
SAS Learning Edition, SAS ProceduresSAS Learning Edition, SAS Procedures, http://support.sas.com/learn/le/proc/index.html.
-
12
Health&WealthMOD: A Microsimulation Model Of The Economic Impacts Of Diseases On Older WorkersInternational Journal of Microsimulation 2:58–63.
-
13
China’s Social Security and Its PolicyChina’s Social Security and Its Policy, September, Beijing, http://english.gov.cn/official/2005-07/28/content_18024.htm.
-
14
Modelling of Medical Insurance System for Urban Employees in China. First General Conference of the International Microsimulation Association20-22, Aug, Vienna, Austria, http://www.euro.centre.org/ima2007/program me/stream2.htm#s4607.
-
15
Basic Consideration of the Medical Insurance System ReformChinese Health Economics Magazine 26:69–71.
Article and author information
Author details
Acknowledgements
The authors of the article are very grateful to the revisions and constructive comments from Prof. Ann Harding and Prof. Laurie Brown, National Centre for Social and Economic Modelling, University of Canberra, Australia. We would like to gratefully acknowledge the funding of a postgraduate research scholarship provided by the University of Canberra. We would also like to acknowledge the editorial advice that has been sought from Clair Mathews, University of Canberra. The project also supported by the National Natural Science Foundation of China (Grant No. 70073171).
Publication history
- Version of Record published: December 31, 2011 (version 1)
Copyright
© 2011, Linping et al.
This article is distributed under the terms of the Creative Commons Attribution License, which permits unrestricted use and redistribution provided that the original author and source are credited.