Cost-benefit model system of chronic diseases in Australia to assess and rank prevention and treatment options
- Australian National University, Australia
- University of Sydney, Australia
- Article
- Figures and data
-
Jump to
- Abstract
- 1. Background
- 2. Aims
- 3. Overview of model system
- 4. Methodology
- 5. Umbrella model
- 6. Disease-specific sub-models
- 7. Linking the umbrella model with disease-specific sub-models
- 8. Validating the model system
- 9. Limitations
- 10. Potential policy relevant applications
- 11. Discussion and conclusions
- References
- Article and author information
Abstract
Chronic diseases – eg heart disease, cancer, diabetes, mental disorders – affect around 80% of older Australians, are the main causes of disability and premature death, and account for 70% of total health expenditures. Because lifestyle patterns are major risk factors, chronic disease prevention and treatment are not only of medical concern, but also of considerable social, family-level and personal interest. While this makes microsimulation approaches particularly suitable for assessing intervention costs and benefits, such approaches will need to be combined with disease-progression models if health status and treatment choices are also to be simulated. Aims: Describe methodological and technical proposals for the development of a cost-benefit model-system. Methods: Several chronic disease progression models are to be linked to an ‘Umbrella’ microsimulation model representing the Australian population. To project 20 years ahead, use of reweighting techniques are proposed for population projections, disease-specific predictions and for health-related projections. The model-system is to account simultaneously for Australians’ demographic, socioeconomic and health-risk-factor characteristics; progression of their health status; the number of chronic diseases (comorbidities) they accumulate over time; health-related expenditures; and changes in quality of life. Standard methods are proposed to estimate costs versus benefits of simulated policy interventions and related quality of life improvements. Key outcome: Proposal of novel methods for modelling comorbidities – a task rarely attempted, although quality of life is known to decline and health expenditures to increase well above what a linear addition of the effects of individual chronic diseases would predict.
1. Background
In most high and middle income countries chronic diseases, such as cancer, heart disease, diabetes and arthritis are strongly associated with morbidity, disability and premature mortality. Their rapid growth and by now epidemic proportions are considered to be major challenges for health policy, as they account for a considerable proportion of public and private health expenditures – World Health Organisation (WHO) 2005a; Begg et al. (2007); Lopez et al. (2006).
Although currently Australians’ health is among the best in the world – with one of the highest life expectancies at birth and at age 65 years – there are concerns about the future due to the country’s obesity prevalence being among the worst in the OECD (AIHW 2006a). Obesity is a major risk factor for chronic diseases (Flegal et al., 2005; AIHW 2004e), such as cardiovascular disease, Type2 diabetes, high blood pressure, certain cancers, sleep apnoea, osteoarthritis, psychological disorders and social problems (WHO 2000). A growing proportion of obese persons and the ageing of the population are likely to increase Australia’s already high chronic diseases and comorbidy prevalences.
In Australia, eight major chronic diseases are considered high priority for policy attention: the National Health Priority Areas (NHPAs) of asthma; cancer; cardiovascular disease; diabetes; injuries; mental health; arthritis and musculoskeletal conditions; and dementia. In 2003, NHPAs accounted for 73% of total burden of diseases resulting, among 65 to 69 year olds, in a 14.7% loss of healthy years lived (Begg et al., 2007). In 2005 chronic diseases affected 80% of older Australians; accounted for 50% of all deaths; and were responsible for 70% of total health expenditures (AIHW 2006c). Because lifestyle patterns – eg unhealthy diets, lack of physical activity, excess alcohol and tobacco consumption – are major risk factors (Yach et al., 2004), chronic disease prevention and treatment are not only of medical concern, but also of social, family-level and personal interest (Seymour 2007; Griffith 2007; Eckersley 2004).
Models able to assess the benefits and costs of potential chronic disease interventions are now used worldwide, partly because of increasing awareness of their usefulness in priority setting, and partly because the alternatives to modelling – such as large-scale long-term clinical trials – are considerably more costly and time consuming. However, there is little in the literature that considers all chronic diseases simultaneously and places these into broad medical, behavioural, social and economic contexts. Earlier research tended to focus on the medical issues associated with a single disease, with a few recent articles considering one comorbid condition as well. Rarely have all major chronic diseases been studied simultaneously, although many share common lifestyle risk factors. Accounting for all chronic diseases is important because quality of life has been shown to decline and health expenditures to increase with comorbidities (Walker 2007a; Shwartz et al., 1996).
At the policy level, there has been recent recognition of the need to target the prevention of chronic diseases, and to limit their negative economic, workforce participation, productivity and quality of life impacts. For example improvement and management of prevention and care are among the stated aims of the November 2005 Australian National Chronic Disease Strategy (Dowrick 2006). Also, in April 2007 the Council of Australian Governments allocated additional funds for chronic disease strategies.
2. Aims
The project aims to:
model at the national level the links between health risk factors and chronic diseases, taking account of comorbidities;
establish how these links vary by demographic and socioeconomic factors;
build models of expenditures relative to benefits; and
obtain rankings for prevention and/or treatment interventions for chronic diseases, comorbidities and/or risk factors.
The key aim of building such a model system is to improve current decision making by providing a more complete view of chronic disease costs and benefits under different prevention and/or treatment scenarios. The purpose of this paper is to document the data and modelling methods proposed for the project. Details are in Walker et al. (2008).
3. Overview of model system
Building the model system requires: (a) the development of a set of person-level demographic, socioeconomic, lifestyle and health variables at a particular point in time; and (b) the projection into the future of both disease-specific incidences and prevalences, and the progression at the level of the individual of chronic diseases and comorbidities. Part (a) involves the bringing together, in a coherent manner, individual-level cross-sectional data from several sources, while Part (b) requires use of disease-specific longitudinal data to estimate the incidence and progression of chronic diseases. We propose modelling (a) and (b) separately, and then link the two parts, so that the ‘big picture’ as well as the ‘detail’ associated with the tracking of individuals’ health can be analysed simultaneously. Policy interventions can then be assessed in terms of broad population-wide variables (eg worse or improved obesity patterns; population screening options); and of disease specific medical treatment (eg surgery or pharmaceuticals).
The proposed model-system, HealthAgeingMod, has two parts: an ‘Umbrella’ static microsimulation model and ‘Chronic disease’ econometric or epidemiology-type sub-models (Figure 1). It is planned that initially the model-system will account for only two chronic diseases: cardiovascular disease (CVD) and diabetes (Type 2). Key reasons for choosing CVD and diabetes are that: (a) they are major contributors to Australia’s total burden of disease (Begg et al., 2007); (b) for people with diabetes CVD is a common complication accounting for 60% of deaths; and (c) CVD and diabetes share common risk factors such as physical inactivity and obesity. Once the benefits of HealthAgeingMod are proven with these two disease-specific sub-models, then further diseases may be added (eg cancers, arthritis, mental health). However, an ability to simultaneously study CVD and diabetes will already be a significant improvement on the traditional disease-by-disease analyses.
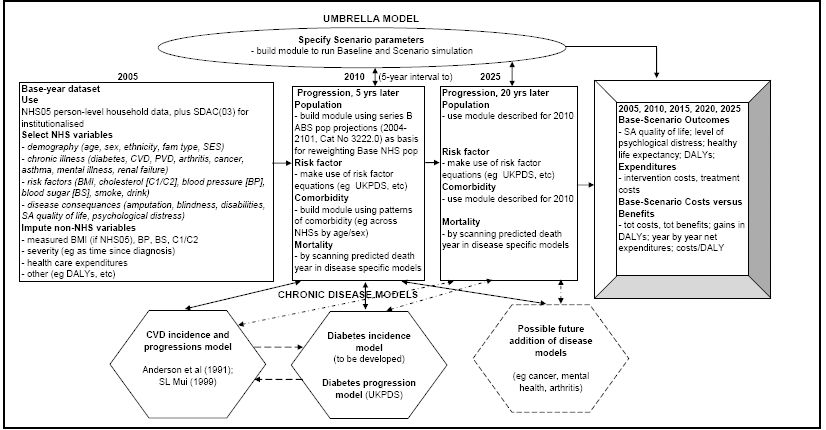

Chronic disease model-system.
In Figure 1, the Umbrella model’s base-year dataset is drawn from the Australian Bureau of Statistics’ (ABS) 2004–05 National Health Survey (NHS05) – (ABS 2006a,b,c,d). Because NHS05 only covers private dwellings (ie mainly households), we propose to complement its unit record dataset with the institutionalised population in ABS’s 2003 Survey of Disability Ageing and Carers (SDAC03) – (ABS 2005a; 2004a,b,c). The list of NHS05 demographic, socioeconomic, risk factor, disease, disability and quality of life variables selected for use in the Umbrella model (in the ‘2005’ Box) is quite comprehensive. However, some NHS05 variables will need to be modified and variables not in NHS05 to be imputed.
We propose that the Umbrella model be able to project 20 years ahead, at 5-year intervals – ie that, from 2005, it project for 2010, 2015, 2020 and 2025. The 5-year intervals will allow simulation of diabetes and CVD screening interventions that are recommended to be repeated every five years. The disease specific sub-models will project ahead at yearly intervals, so disease specific projections that are likely to be needed yearly (eg onset of diseases, deaths) can be stored during the simulation phase. The population projections will be estimated so that the model’s weighted base population lines up, to the extent possible, with published ABS population projections (ABS 2005b). Then the Umbrella Model will consult each chronic disease model to estimate, probabilistically, how each person’s risk factor profiles and chronic disease(s) would develop over the 5-year period being considered, and whether the person would have any new chronic diseases. An important challenge will be to find appropriate ways to project the evolution of individual-level risk factors and comorbidities, and then ensure that in aggregate these individual- level time profiles line up with published aggregate statistics.
Running the Umbrella Model in ‘default’ mode (ie no policy change) will provide the baseline simulation (Figure 1, ‘Base-Scenario Outcomes’ Box). To allow for the simulation of policy interventions, a ‘Specify Scenario parameters’ box will need to be added to the Umbrella model, and filled-in prior to Scenario simulations. The baseline and scenario results will then be compared in terms of differences in health outcomes – eg Disability Adjusted Life Years (DALYs) avoided – and in health expenditures. The Outcomes module will also present year-by-year net benefit and cost streams, and compute cost effectiveness indicators (eg cost/DALY avoided).
4. Methodology
For both the Umbrella and the sub-models, most of the methods proposed are ‘current best practice’. However, there will be challenges, such as: developing new methods to model comorbidities; modifying traditional methods to accommodate much improved up-coming datasets; and linking the elements of HealthAgeingMod so that both the disease and comorbidity details can be validated against published aggregate statistics. The methods eventually used will be documented once HealthAgeingMod is built. Those proposed in this paper are described below.
The Umbrella model will be based on microdata (that is person-level information), and will make use of microsimulation techniques. Because models based on microdata deal with the individual, use of such models allows the impact of policy changes to be examined in far greater detail than is possible with more traditional approaches. Since the SAS programming language has proved to be particularly suitable for microsimulation projects, we propose to use SAS for building the Umbrella model, as well as its linkages with the disease-specific models.
The Umbrella model will represent the full Australian population through use of the ‘weights’ embedded in NHS05 (ABS 2006b). The proportion of the total population with a particular chronic disease is generally small (eg 3.5% for diabetes; 2% for both angina and other ischaemic heart diseases – ABS 2006a). Because of this we propose that each survey individual with one or more of the chronic diseases be transformed into a number of unit records, summing to the ‘weight’ initially attached to that survey individual. Enumeration of all persons with the chronic disease will allow a much finer specification of the health variables imputed onto the Umbrella model’s base dataset (eg measured glucose levels) than what would be possible without such enumeration. The sub- models will be disease-specific incidence and/or progression models, predicting changes over time in the health states and risk factors of each individual included in the Umbrella model’s population. Disease-specific models can be of varied types: eg econometric, transition probability, parametric, proportional hazard or Weibull models. The model-system will also make use of standard cost-benefit and cost effectiveness methods (Jena and Philipson 2007).
5. Umbrella model
As noted above, the Umbrella model will be of the microsimulation type. Although microsimulation was first proposed in the 1950s (Orcutt 1957; Orcutt et al., 1961), its general use had to wait until computer technology improved and large microdatasets became routinely available. While many full population-based microsimulation models had been, or are being, developed worldwide, most fall within the tax and social security fields (see review in Zaidi and Rake 2001). The few that account for health tend to be either of the socioeconomic type, which use a broad indicator of health as a covariate within the larger picture, or of the disease-specific type, designed to study disease specific treatment options so as to assess their cost effectiveness (see reviews in Lymer 2009 and Walker 2009).
Major model building requirements include ability to: (a) account for comorbidities. For this the Umbrella model will need to track individuals over time – from the onset of their first chronic disease; the contracting of their second, third etc chronic diseases; until death.; (b) represent all Australians, so that broad public health policy initiatives can be studied; and (c) simultaneously consider a wide range of social, economic, health and person-level variables. While many of these are now routinely available in ABS surveys, indicators of the important linkages between physical health, mental health and general wellbeing are in general significantly under- represented (Appleby 2006; Wilkinson 2005; WHO 2005b). These requirements suggest a dynamic microsimulation model based on nationally representative longitudinal unit record data. However, in Australia such datasets tend to be cross-sectional in nature. Also, although such datasets do contain a wide range of variables, the aggregate nature of many of the disease-level variables means that they do not fully meet our requirements. Hence we propose a static microsimulation Umbrella model, with its base-year population projected 20 years ahead at 5-year intervals.
5.1 Choice of data sources
The most suitable data for the Umbrella model’s base-year population are the ABS’s nationally representative cross sectional Confidentialised Unit Record Files (CURFs). The Bureau’s health and disability surveys cover most variables relevant to this project, although not always at the level of detail required. The National Health Surveys (NHSs) only concern private dwellings. Thus, although people in institutions often have poor health, the NHSs exclude those in nonprivate dwellings (such as hospitals, hostels, nursing homes). Limited information on the institutionalised is however available from the ABS’s Survey of Disability, Ageing and Carers (SDAC). Because these surveys are repeated every three to six years, aggregate ‘trend’ information can be obtained by studying changes in patterns across the cross-sectional surveys.
Both the NHS05 and SDAC03 rely on self-reported data; use multistage sampling techniques, and are based on interviews with qualified ABS personnel in private dwellings. SDAC also has information on the institutionalised through questionnaires filled in by institution staff. The related CURFs comprise around 25,000 unit records for NHS05 and 40,000 for SDAC03, each with over 1000 demographic, socioeconomic, health, etc variables, as well as ABS-estimated person-level ‘weights’. The application of weights ensures that survey-based population-wide estimates will conform by age, sex and State to independently estimated national distributions. In NHS05, the disadvantages associated with self-rated data are attenuated through most respondents with NHPA conditions reporting that they had been medically diagnosed with these diseases (ABS 2006d).
Because the NHSs have the broadest relevant variable coverage, the most recent of these, NHS05, was initially selected to provide the Umbrella model’s base population. To this population we propose to add the institutionalised embedded in SDAC03. Because NHS08 – expected to become available in late 2009 – will have additional and more detailed data, we plan to update the Umbrella model’s base data in 2009 using the NHS08 CURF. This will allow use to be made of NHS08’s new features, such as measured Body Mass Index (BMI) and disability status data.
To impute more detailed or ‘not in NHS05’ variables onto the Umbrella model’s base-year dataset we propose to use the AusDiab longitudinal database (International Diabetes Institute 2006). AusDiab is a national longitudinal study, with 11,247 persons surveyed in the 1999- 00 (Wave 1), and 6,500 of these attending the 2004–05 update (Wave 2). Another 2000 of the Wave 1 group who could not attend the up-date provided survey information. AusDiab has extensive individual-level data on diabetes, its risk factors and its complications, and on CVD. It is thus an excellent source for validating and imputing from, when developing the Umbrella, Diabetes and CVD models.
In summary, the data sources initially proposed for the Umbrella model are: (a) NHS05 (private dwellings) and SDAC03 (non-private dwellings) Basic CURFs; (b) NHS08 (private dwellings) and SDAC08 (non-private dwellings) Basic CURFs as up-dates; (c) AusDiab (2000 and 2005 waves) and (d) earlier and current NHS/SDAC CURFs to establish time-trend patterns (eg for aligning and/or validating HealthAgeingMod).
5.2 Variables chosen for the umbrella model
We selected the variables shown in the literature as having a major impact on NHPA chronic diseases and comorbidities. We classified these into three groups: (a) not needing modification; (b) needing modification; and (c) not in NHS05/SDAC03 and thus needing imputation.
(a) Variables not needing modification
The chosen NHS05 demographic and geographic area variables are: age (5-year groups; 85+), sex, State and an area indicator (Major cities, Inner regions, Other). Although chronic diseases are more common among older adults, the Umbrella model’s base data will cover all age groups. This is because obesity – a key risk factor for many chronic diseases – can start in early childhood (Baird et al., 2005; Venn et al., 2007). Other variables suitable for the Umbrella model were initially identified by Walker (2007a) from the NHS01 CURF. Similar NHS05/SDAC03 variables are listed below.
Quality of life
While there is increased interest in health-related quality of life (QoL) as an indicator of subjective well-being (O’Connor 2004), the construct of such indicators poses methodological difficulties (Baumeister 2005). In particular there is no consensus on whether their measurement should be based on generic or disease-specific approaches (O’Connor 2004). For the Umbrella model we chose the generic approach because it was shown to be more suitable for comparisons across population groups (Cella & Nowinski 2002). That is, questions about an individual’s overall satisfaction with life and general sense of personal and psychological well-being were considered more appropriate than any question mentioning a particular disease – O’Connor (2004). In NHS01 and NHS05 the general health and quality of life question(s) were asked before any illness-specific questions, so as to avoid disease-specific questions influencing respondents’ perceptions of their overall health and QoL.
NHS05 contains only one QoL indicator, compared with two in NHS01. Based on the findings of Walker et al. (2008), we propose to impute from NHS01 the ‘Delighted to Terrible Scale’ variable, which is not available in NHS05.
Health status
we chose the NHS05 self-assessed general health variable as the indicator of health status. Asked before any specific illness-related questions, this health question was: ‘In general would you say your health is ‘Excellent’, ‘Very good’, ‘Good’, ‘Fair’ or ‘Poor’. This is Item 1 of the Short Form 36 (SF36) – O’Connor (2004); ABS (2003b). Although self-rated health is viewed by some with suspicion, the literature proved it to be an independent predictor of mortality (Idler & Benyamini 1997; Mossey and Shapiro 1982).
Comorbidity
Although complex, the study of comorbidities is important because they have a strong negative impact on quality of life and on health expenditures (Walker 2007a; Shwartz et al., 1996; Mossey & Shapiro 1982). We chose as the comorbidity indicator the NHS05 count of each survey respondent’s major chronic illnesses. This count concerns conditions that respondents had been told by a doctor or a nurse that they had at the time of the interview, and which had lasted or was expected to last for 6 months or more.
A disadvantage of the number of chronic conditions variable is that it accounts for both life threatening and less serious health conditions (eg for heart disease as well as for reduced sight). Because SDAC03 contains information on the severity of disability, we propose to improve the comorbidity indicator by imputing a ‘severity factor’ from SDAC03 onto the Umbrella model’s Base population.
Socioeconomic status
has been shown to be associated with health status, comorbidities and functionality (AIHW 2002a,d; Begg et al., 2007). The most commonly used indicators of socioeconomic status (SES) are the ABS’s geographic area-based Socioeconomic Indexes for Areas (SEIFAs) – ABS 2003a. SEIFAs are not ideal, because everyone living in a geographic area is allocated the same SES, and because geographically based indicators have been shown to considerably underestimate the extent of health inequalities by socio-economic status (Walker & Becker 2005). We propose to use as the indicator of SES the NHS05’s gross weekly equivalised cash income quintile variable. While this variable has the usual reliability problem associated with survey income data, it has the advantage of being ‘equivalised’, thus reflecting each person’s living standard within the household.
Education
is a variable associated with both SES and health (AIHW 2002d). To account for secondary as well as tertiary education, we propose to construct a new education variable using both the NHS05 ‘highest year of school completed’ and ‘highest post-school qualification’ variables.
Social support
impacts on health, since living alone, social isolation and mental health were found to be correlated with social exclusion (AIHW 2002d; Taylor et al., 2004). To indicate individual-level differences in the extent of social support, we propose to construct a ‘living situation’ variable, which will be 1 if the person lives alone, and 0 if the person lives with others.
Work status
Australians in good health are more likely to have a job than those in poor health (Walker 2007b). Also, chronic illnesses are associated with considerable work days lost (AIHW, 2005a). Data on work status, together with data on main source of personal cash income, could be used to construct a partial indicator of chronic disease severity. For example, if an older person reported a high number of chronic diseases, worked only a few hours a week and reported government as his/her main source of income, then ill heath may have had a negative influence on that person’s living standard.
Tobacco
smoking is a major risk factor for chronic diseases (AIHW 2002d). We propose to construct a (0,1) variable indicating the extent of tobacco use from the NHS05 variables – for 18+ year olds – of having never smoked, or being a current or past smoker.
Alcohol
Excessive alcohol consumption is also an important risk factor for chronic diseases (AIHW 2002d). The indicator chosen for the Umbrella model is the NHS05 ‘alcohol risk level’ variable.
(b) Variables needing modification
Overweight and obesity
is considered by the World Health Organisation to have reached epidemic proportions (WHO 2005a), and is known to be a major risk factor for several long-term chronic diseases (AIHW 2002d). However, the detail on overweight/obesity in NHS05 is insufficient for purposes of linking the Umbrella model to the chronic disease sub-models. The NHS05 indicator of overweight/obesity for 15+ year olds is the Body Mass Index (BMI). It is based on self-reported height and weight data and is grouped into three thin, two normal and three overweight categories. What the chronic disease sub-models need, however, is continuous measured values of BMI at the level of the individual. Combined with the grouped NHS05 BMI information, we propose use of the AusDiab data to estimate continuous measured BMI values for individuals in HealthAgeingMod’s basedata, and to check these estimates against NHS08 measured BMI benchmarks once the NHS08 CURF becomes available.
Blood pressure, cholesterol and blood glucose levels
High blood pressure, high cholesterol (total and LDL) and high blood glucose levels are known risk factors for several chronic illnesses (ABS 2003c). The detail at which these variables are available in NHS05, that is whether ‘ever told has condition by a doctor or nurse’, is once again insufficient for our purposes. Combined with this broad level NHS05 information, we propose use of AusDiab to estimate continuous measured values for blood pressure, cholesterol and blood glucose levels.
(c) Variables needing imputation
Burden of disease
To measure the health benefits arising from the policy interventions simulated we will need to attach, to each person in the Umbrella model’s base dataset, an indicator of the burden of their diseases. From among the commonly used health outcome measures we propose the Disability Adjusted Life Years (DALY) indicator (Hartge 2006; Steenland & Armstrong 2006; Lopez et al., 2006; Begg et al., 2007), for which generally accepted disease burden weights are available. These will need to be imputed onto each basedata individual.
Health care costs
Data on health expenditures will also need to be imputed. Earlier researchers found that in the 1990s the costs of treating Australians with comorbidities were five times that of other persons (Department of Health and Aged Care, 2000), and that the costs for people with multiple conditions were well above what a linear addition of the effects of individual chronic diseases would have predicted. We propose to use published health expenditure data, such as AIHW (2005b,c; 2006d), Clarke et al. (2007) and Wolff et al. (2002).
5.3 Developing the base-year dataset
The first step in developing the Umbrella model’s base-year dataset involves: (a) extracting the chosen variables from NHS05; (b) examining, for each of these variables, the extent of ‘non- response’; and (c) deciding whether the level of ‘non-response’ is acceptable. In ABS surveys the variables most likely to have unacceptably high levels of ‘non-response’ are the income-based variables, and variables concerning certain diseases (eg mental illness). If the level of ‘non-response’ is acceptable (say less than 3–5%), then deleting the records with ‘non-response’ may be an option. However if too many variables require deletions, then this would detract from the nationally representative nature of the initial CURF population. An alternative is to impute onto records with ‘non-response’ values for the related variables, so that their distribution across the whole population (eg by age/sex groups) does not affect the group averages.
As seen earlier, the second step involves modification of those NHS05variables that do not exactly meet our purposes and the third imputing variables that are not in NHS05. For most imputations we propose to use the Monte Carlo method. It involves the drawing of a random number, z, from a uniform distribution over the interval [0, 1], and then comparing it to published targets – eg the prevalence of high/low blood glucose levels by age/sex/BMI groupings. If the random number is below the relevant target, then the person being processed is allocated to that particular blood glucose group.
5.4 Projecting 20 years ahead
The Umbrella model’s projection module will estimate: (1) the ‘ageing’ of the model’s base population at 5-year intervals (preferably by age, sex and broad health status/comorbidity); (2) the health state transitions for each person in that population in each time interval; and (3) the value of the comorbidity index for the period. Figure 2 presents a flowchart of the projection module.
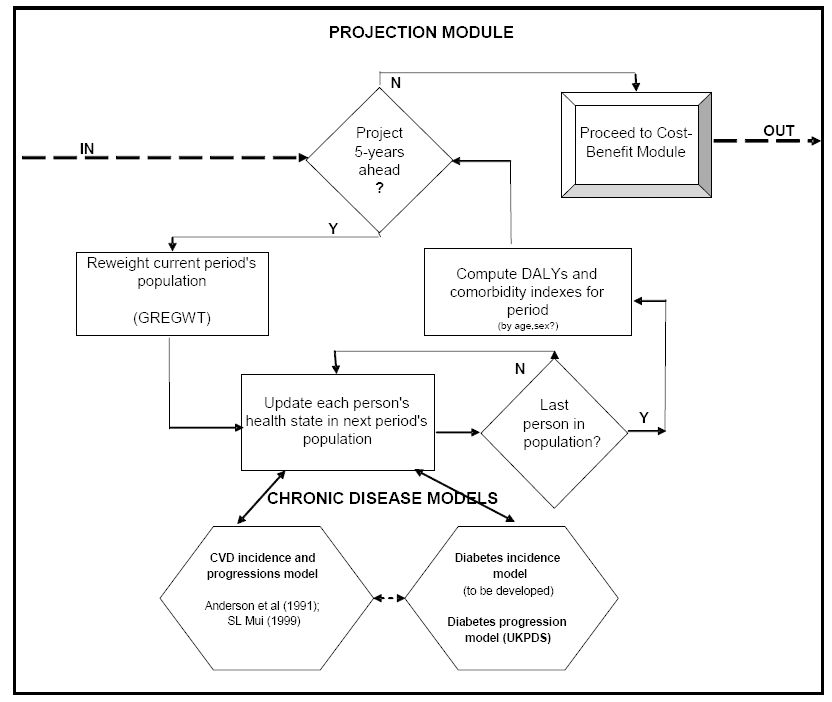
Umbrella model’s projection module.
For step (1) we propose the ‘reweighting’ method, using the ABS’s GREGWT optimising software. Briefly, the optimising ‘reweighting’ method involves changing the original sample survey weights, so that application of the new weights (from GREGWT) reproduces the population distribution forecast by ABS (2005b) for the 5-year time period being considered. Step (2) will up-date the health states of each individual in the Umbrella model’s base population by querying the relevant disease specific sub-models. Step (3) will compute health benefits (in DALYs) and track each individual’s comorbidity pattern.
This latter task will be particularly challenging and time consuming as it will require development of new methods to adequately account for comorbidities. Extensive discussions with peers in Australia and overseas are planned, particularly regarding the strengths and weaknesses of possible ‘comorbidity’ options. Another challenge for the projections module will be to ensure that both its disease and its comorbidity projections can be validated against published official health statistics. It may be that the best way to do this would be to align the overall model-generated disease progression and comorbidity patterns with external targets. Should this be required, there will probably be a need to develop an appropriate automated alignment method, as methods for aligning microsimulation models are still at an early stage of development (Walker 2009).
5.5 Cost-benefit analysis of proposed interventions
Cost–benefit analysis has the advantage – over cost-minimisation, cost-effectiveness and cost-utility analyses – of using money, a common neutral measure, for both costs and benefits. The method involves computing monetary flows of costs and benefits over time. In most studies discounting is used to account for people’s general preference for money ‘in the hand now’ (rather than for money expected in future). From the streams of costs (or benefits) a single measure is often computed in the form of net present value (NPV). NPV is the sum of the yearly discounted cash values over that period. From the NPVs either a net gain (that is, benefits minus costs) or a benefit–cost ratio (that is, benefits divided by costs) can be computed, which can then be used for ranking various proposals. A disadvantage of this approach is that not all costs or benefits can be expressed in monetary terms. However, the cost-benefit approach can be complemented with cost-utility analysis to allow for consideration of hard-to-measure factors such as disability-free life years gained. This is what we aim to achieve through estimation of DALYs.
We propose that the Umbrella model’s ‘Cost-benefit module’ first be run in ‘default’ mode (ie no policy change). This will provide the baseline simulation. Next, the model is to be run in ‘Scenario’ mode (ie with the policy change). The ‘Cost-benefit module’ will then compare the baseline and scenario health outcomes in terms of DALYs avoided, as well as the base-scenario differences in terms of monetary benefits and costs. The module will also present year-by-year net expenditures; compute cost effectiveness indicators (such as cost/DALY avoided); and estimate monetary benefit to cost ratios. Once several scenarios had been simulated, they are to be ranked by one or more indicators (eg cost/DALY; benefit to cost ratio). Colagiuri and Walker (2008) present an example of this process for a diabetes-specific prevention and care intervention scenario using a dynamic-group-simulation-model.
6. Disease-specific sub-models
A number of models have been reported in the literature which simulate the incidence and/or progression of CVD and diabetes (eg Mui 1999; Clarke et al., 2004; Colagiuri and Walker 2008). In this project we aim to make use of existing disease-specific models, since the challenge is to build a complex and validated model-system and not the development of disease-specific models. Our chronic disease models will need to be able to carry out four functions: (1) up-date the ‘risk factors’ of the person being processed; (2) predict who will become ‘newly diagnosed’ (with diabetes and/or CVD) within the period being considered; (3) for those already diagnosed, predict the progression of their disease(s); and (4) keep records of the risk factors, health status and comorbidity status of the person being processed – with the records being accessible by the Umbrella model.
6.1 Diabetes sub-model
6.1.1 Background
In recent years diabetes was one of the most important contributor to Australia’s total burden of diseases (Begg et al., 2007) with around 3.5% of Australians (700,000 persons) diagnosed with the disease (ABS 2006a). Although Type2 diabetes is more common among older Australians, it is increasingly affecting younger age groups (AIHW 2006b). Also, diabetes related health system costs were high at around $0.8 billion (AIHW 2004a).
6.1.2 The Diabetes sub-model
We propose that the Diabetes sub-model focus on Type 2 diabetes. Although data on Type1 and its complications will be recorded in the Umbrella model’s base dataset, we propose to model Type1 diabetes in a considerably less complex way than Type2 diabetes. For the latter we will need separate incidence and progression modules. For those already diagnosed, there are several individual-level models able to predict the progression of Type2 diabetes. Although such models were built for different countries and use varied programming languages, we aim to use one of these as our ‘diabetes progression module’.
Incidence module
Because modelling the incidence of diabetes is considerably less complex than modelling its progression, we propose to build the incidence module in-house, making use of an external data source such as AusDiab. This is because between 1999–00 and 2004–05 Australians with pre-diabetes were found to be 7–8 times more likely to develop diabetes than people with normal blood glucose levels (Magliano et al., 2008).
Progression module
Earlier diabetes models – Eastman (1997a,b); Institute for Medical Informatics and Biostatistics (1997a,b); Bagust et al. (2001); Walker et al. (2003) – were plagued with data limitations and thus could not fully capture the clustering of the chronic diseases that tend to develop as complications of diabetes. These limitations were attenuated in the more recent United Kingdom Prospective Diabetes Study (UKPDS) Outcomes Model, which is based on longitudinal, validated data comprising 3642 persons with diabetes (Clarke et al., 2004). It estimates, at the level of the individual, a set of Weibull and Gompertz equations which predict the first occurrence and timing of each of seven Type 2 diabetes complications: fatal or non-fatal myocardial infarction (MI), other IHD, stroke, heart failure, amputation, renal failure, eye disease (measured as blindness in one eye) and death. Explanatory variables include: age, sex, race, smoking status, BMI, history of complications; and risk factors. Using random effects panel data regressions, the UKPDS model also estimates the progression of Type 2 diabetes risk factors, and computes quality-adjusted life expectancies.
We propose – and obtained permission to use – the UKPDS Outcomes model as our Diabetes sub model’s progression module (Walker et al., 2008). Challenges in incorporating this model into our model-system include: the matching of the relevant variables across the Umbrella and the UKPDS models; interfacing the two models programmed in different languages; and ensuring that the UKPDS model provides all the diabetes-related estimates required by the Umbrella model.
6.2 Cardiovascular disease sub-model
Cardiovascular disease (CVD) continues to be a major cause of deaths (AIHW 2004f) and a major contributor to Australia’s total burden of disease (Begg et al., 2007).
We propose to build a CVD incidence model with separate equations for stroke and for coronary heart disease. Earlier CVD model builders – eg Mui (1999) – used the Anderson et al. (1991) cardiovascular risk equations and these are still considered to be appropriate predictors of CVD incidence in developed countries. Indeed, the newly endorsed 2009 National Health and Research Council guideline recommends using this equation in Australia. Thus, for the CVD incidence model’s ‘default’ mode, we propose the Anderson et al. (1991) equations (Table 1). They are based on 5573 initially CVD-free 30 to 74 year olds from the US Framingham Heart and Framingham Offspring studies. The period covered was 1968 to 1975, including 12-year follow-ups. The Anderson parametric statistical equations separately predict probabilities for: MI, coronary heart disease (CHD), CHD death, stroke, CVD and CVD death. Explanatory variables include age, sex; systolic blood pressure, cigarette smoking, cholesterol (ratio of total to HDL) and diabetes. One advantage of the Anderson parametric model -compared with standard regression models – is that predictions can be obtained relatively easily for different lengths of time. The authors recommended time intervals of 4 to 12 years. They concluded that, apart from stroke, the CHD equation was a good predictor for all the other conditions modelled. Hence our proposal to only use in our CVD model the CHD and stroke equations.
Coefficients of the Anderson CHD and stroke equation.
| Explanatory variables | CHD | CHD deaths | Stroke | CVD deaths |
|---|---|---|---|---|
| θ0 | 0.9145 | 2.9851 | −0.4312 | 0.8207 |
| θ1 | −0.2784 | −0.9142 | − | −0.4346 |
| β0 | 15.5305 | 11.2889 | 26.5116 | −5.0385 |
| female | 28.4441 | 0.2332 | 0.2019 | 0.2243 |
| log(age) | −1.4792 | −0.9440 | −2.3741 | 8.2370 |
| (log(age))2 | − | − | − | −1.2109 |
| log(age)* female | −14.4588 | − | − | − |
| (log(age))2 * female | 1.8515 | − | − | − |
| log (SBP) | −0.9119 | −0.5880 | −2.4643 | −0.8383 |
| cigarettes (Y/N) | −0.2767 | −0.1367 | −0.3914 | −0.1618 |
| log (total-C/HDL_C) | −0.7181 | −0.3448 | −0.0229 | −0.3493 |
| diabetes | −0.1759 | −0.0474 | −0.3087 | −0.0833 |
| diabetes * female | −0.1999 | −0.2233 | −0.2627 | −0.2067 |
| ECG-LVH | −0.5865 | −0.1237 | −0.2355 | −0.2946 |
-
Source: Anderson et al. (1991).
Another – particularly desirable – feature of the Anderson et al. (1991) equations is that they allow for consideration of people who will develop CVD, as well as people who have both diabetes and CVD. Use of this feature in HealthAgeingMod will allow considerable simplification of the CVD to diabetes interactions. We propose to do this by including people with both diabetes and CVD in the Diabetes sub-model only, and people with CVD only in the CVD sub-model. An unexpected feature of the Anderson equations is that BMI was found to be statistically insignificant. However, certain pre and post 1991 research using Framingham data found that BMI was an independent risk factor for CVD (Hubert et al., 1983; Kenchaiah et al., 2002). Since in obesity- related simulations of public health interventions non-presence of BMI in the equations could result in benefits being significantly underestimated, we may on occasion need to consider alternative CVD equations. In such instances, the linkages between the diabetes and CVD sub-models may need to be reconsidered.
6.3 Linkages between diabetes and CVD models
Published statistics indicate that there are considerable links between the diabetes and CVD chronic diseases. For example, ABS (2006a) found that 20% of people (and 27% of 65+ year olds) with diabetes also reported having a long term heart, stroke or vascular disease. Also, Barr et al. (2007) reported that over two-thirds of all CVD deaths in the AusDiab cohort occurred in people with diabetes or pre-diabetes. Although being able to apply the CVD model only to persons without diabetes makes the linking of diabetes and CVD sub-models unnecessary, statistics of this kind are expected to be useful when validating the chronic disease model-system.
7. Linking the umbrella model with disease-specific sub-models
The steps proposed for the Umbrella to Diabetes and CVD model linkages are as follows.
Every time the Projection module processes an individual in the Umbrella model’s population, the module first queries whether the person has diagnosed diabetes. If yes, then it obtains risk factor and disease progression estimates from the UKPDS model and updates these in the person’s Umbrella model records. If no, then the Projection module obtains up-dated risk factor estimates for people without diabetes, and uses these when querying the Diabetes incidence module.
If the person is found to have ‘new’ diabetes, then his/her records are up-dated in the Umbrella model. From then onwards, CVD for this person with diabetes will be assessed and progressed via the UKPDS model.
If however the person is found not to have ‘new’ diabetes, then the Projection module queries the CVD incidence module to determine whether the person has newly diagnosed fatal or non-fatal CHD or stroke. If yes, then the person’s records in the Umbrella model are updated. If no, then the Projection module moves on to process the next person in the Umbrella model’s population.
8. Validating the model system
Acceptance and use of HealthAgeingMod for policy relevant applications crucially depends on it being convincing validated against publicly available benchmark statistics. We propose that validations be carried out both at cross-sections and over time. Zaidi and Rake (2001) note that when models are constructed from several sub-modules, there will be multiple sources of error and thus there will be many levels at which validation could occur. They suggest that in such cases consideration should be given to use of multiple-module validation techniques. Although multiple-module validation is rarely used, we propose to consider it in this project as it could offer additional insights into the workings of the Umbrella model.
As initial steps, we propose validation in four phases once the prototype is built and had been aligned. This would involve:
comparing the estimates obtained from use of overseas material (ie the UKPDS model and the Anderson CVD equations) with the few available and/or forthcoming Australian benchmarks;
checking that, once data transformations and imputations had been completed, the aggregate statistics generated by HealthAgeingMod for its base year closely match the related external benchmarks (eg by the ABS and AIHW);
for diabetes and CVD, comparing model system projections with the trends indicated by published cross sectional benchmarks (such as the NHSs). Checks against external statistics are proposed for disease incidence, prevalence, deaths, health outcomes (DALYs) and health expenditures;
HealthAgeingMod outputs from ‘test’ scenario simulations are proposed to be compared with published results produced by other models that simulated similar scenarios.
9. Limitations
One limitation of our model system – as of other models and most statistical collections – is their inability to fully replicate the real world. Nevertheless, models can handle considerable complexity and, if they contain key variables and their inter-relationship, then model simulations can prove to be very valuable to decision makers. We aim to ensure our model system’s policy usefulness by including all the variables identified in the literature as key drivers of disease incidence, prevalence and health expenditures.
Another limitation arises from use of the Monte Carlo method, since this method introduces randomness into the model’s outputs. That is, different runs of the model – with identical parameters but using different random number seeds – will produce different outputs. To assess the importance of the related stochastic variation it will be necessary to execute several runs until the results ‘converge’ within set bounds. Earlier researchers found that, with microsimulation models, the number of repetitions required to achieve ‘convergence’ was relatively small – four runs in Pudney and Sutherland (1993; 1994) and six runs in Walker et al. (2006a,b). A further limitation may arise if attribution of burden of disease to a particular risk factor (eg obesity) is required. In such cases we will endeavour to choose the attribution method that is least likely to create limitations. Such a choice may however be restricted due to unavailability of appropriate data (Hartge 2006; Steeland and Armstrong 2006).
10. Potential policy relevant applications
Possible applications include: (1) simulating the impact of various lifestyle interventions (eg obesity/overweight, smoking, alcohol consumption) on health outcomes and health care costs associated with individual chronic diseases and with comorbidities (diabetes and CVD initially); (2) comparing such analyses across chronic diseases individually, and the diseases combined (eg across groups of 2, 3, 4, or 5+ illnesses). The aim would be to identify key comorbidity patterns and the intervention points most likely to be effective; (3) simulating the impacts of various combined lifestyle and disease-specific treatment options, and carrying out cost-benefit analyses so that these highly complex options can be assessed and ranked.
11. Discussion and conclusions
The proposals in this paper show that the tasks set for the project are not only complex, but also require considerable creativity and innovation. Key novel elements are that the proposals cover both the broad socioeconomic and the detailed disease specific aspects; that they account for several chronic diseases, modelling the onset and progression of each; and that the onset or progression of these diseases depend on their often common risk factors. The proposals thus allow simulation of complex chronic disease policy reforms that can combine medical treatment options (eg a new drug being used for diabetes and/or new hospital procedures for stroke management) with lifestyle changing options (eg diet and/or exercise) and with socioeconomic reform options (eg improving the health of poorer population groups).
Another important novel element is HealthAgeingMod’s ability to assess the full benefits of interventions that target risk factors common to several chronic diseases. For example, in traditional models (Eastman et al. (1997a, b); Clarke et al. (2004); Colagiuri and Walker (2008)), the estimated benefits from single-disease-prevention interventions are limited to that disease itself, even when the intervention affects a risk factor – such as obesity – that is common to several chronic diseases. HealthAgeingMod can simultaneously analyse risk factor interventions that impact on multiple chronic diseases, so its benefit estimates are more comprehensive than those of traditional models. At the policy level, availability of such an improved model is likely to encourage consideration of more complex interventions that simultaneously target multiple-chronic diseases.
Another novel element, which is difficult to handle analytically and to place in a nation-wide context, is the estimation of the number of chronic diseases that individuals are likely to accumulate as they age. The difficulty arises in part from national health data collections tending to focus on single diseases, and in part from the number of diseases a person has being rarely available in data sources and being hard to model.
During the model building phase further creativity and innovation will be needed in: (1) data collection, selection and linkage; (2) approaches and methods chosen for the building of HealthAgeingMod; and (3) broadening of the boundaries of the health sectors analysed – the coverage comprising individuals’ lifestyles, individuals as patients, medical treatment options, and government policy initiatives in health care as well as in prevention. However, our proposals show that while there are constraints on what is achievable in the short term, already planned data collections and methodological progress could in future result in significant improvements in models such as HealthAgeingMod.
In view of the above we expect that, once built, the proposed model-system and its applications will demonstrate the benefits of a system-wide approach to chronic disease and comorbidity prevention and treatment. Given the considerable quality of life benefits from prevention, as well as lesser demand for doctors, pharmaceuticals and hospital services, an important goal for HealthAgeingMod applications will be to clearly indicate the relative merits of prevention options versus treatment options.
References
-
1
National Health Survey 2004–05, Summary of ResultsNational Health Survey 2004–05, Summary of Results, Cat No 4364.0, Canberra.
-
2
National Health Survey 2004–05National Health Survey 2004–05, Confidentialised Unit Record Files.
-
3
National Health Survey 2004–05: CURF Information PaperNational Health Survey 2004–05: CURF Information Paper, Cat No 4324.0 and National Health Survey 2004–05 Questionnaire, Cat No 4363.0.55.002.
-
4
National Health Survey 2004–05, User GuideNational Health Survey 2004–05, User Guide, Cat No 4363.0.55.001.
-
5
Disability Ageing and Carers, 2003, Confidentialised Unit Record Files Information Paper (Reissue)Disability Ageing and Carers, 2003, Confidentialised Unit Record Files Information Paper (Reissue), Cat No 4430.0.00.001.
-
6
Projections of the Populations of Australia: 2004–2101Projections of the Populations of Australia: 2004–2101, Cat no 3222.0.
-
7
Disability Ageing and Carers, 2003Disability Ageing and Carers, 2003, Confidentialised Unit Record Files.
-
8
Disability Ageing and Carer, 2003Disability Ageing and Carer, 2003, Summary of Findings, Cat no. 4430.0.
-
9
Disability Ageing and Carer, 2003Disability Ageing and Carer, 2003, User Guide, Cat no. 4431.0.55.001.
-
10
Diabetes in Australia: A SnapshotDiabetes in Australia: A Snapshot, Cat no 4820.0.55.001.
-
11
Census of Population and Housing: Socioeconomic Indexes for Areas 2001. Information PaperCensus of Population and Housing: Socioeconomic Indexes for Areas 2001. Information Paper, Cat no 2039.0.
-
12
National Health Survey 2001National Health Survey 2001, User Guide, Cat No 4363.0.55.001.
-
13
Health risk factors, Australia 2001Health risk factors, Australia 2001, Cat No 4812.0.
-
14
National Health Survey 2001, Summary of Results, Cat No 4364.0National Health Survey 2001, Summary of Results, Cat No 4364.0.
- 15
-
16
Socioeconomic inequalities in cardiovascular disease in Australia: Current picture and trends since 1992Socioeconomic inequalities in cardiovascular disease in Australia: Current picture and trends since 1992, AIHW Bulletin 3, Canberra.
-
17
Chronic diseases and associated risk factors in Australia 2006Chronic diseases and associated risk factors in Australia 2006, AIHW Cat No PHE 81, Canberra.
- 18
-
19
Obesity and workplace absenteeism among older AustraliansObesity and workplace absenteeism among older Australians, Canberra.
- 20
-
21
Health system expenditure on disease and injury in Australia 2000–01Health system expenditure on disease and injury in Australia 2000–01, Canberra.
- 22
-
23
Disability and its relationship to health conditions and other factorsDisability and its relationship to health conditions and other factors, Canberra.
-
24
The impact of dementia on the health and aged care systemsThe impact of dementia on the health and aged care systems, Canberra.
- 25
-
26
The relationship between overweight, obesity and cardiovascular diseaseThe relationship between overweight, obesity and cardiovascular disease, Cat. No. CVD 29, Canberra.
-
27
Heart, Stroke and Vascular Disease-Australian facts 2004Heart, Stroke and Vascular Disease-Australian facts 2004, AIHW Cat. No. CVD 27, Canberra.
-
28
Older Australians at a GlanceOlder Australians at a Glance, Third Edition, AIHW cat. no. AGE25, AIHW and DoHA, Canberra.
-
29
Diabetes: Australian Facts 2002Diabetes: Australian Facts 2002, Diabetes Series No. 3 AIHW Cat. No. CVD 20, Canberra.
-
30
Diabetes: Australian Facts 2002Diabetes: Australian Facts 2002, Diabetes Series No. 3 AIHW Cat. No. CVD 20, Canberra.
- 31
-
32
Health system costs of diseases and injury in Australia 1993–9Health system costs of diseases and injury in Australia 1993–9, AIHW Cat. No. HWE 5, Canberra.
- 33
- 34
-
35
An economic model of the long-term health care burden of type ii diabetesDiabetologia 44:2140–55.
-
36
Being big or growing fast: systematic review of size and growth in infancy and later obesityBritish Medical Journal 331:929.
-
37
Risk of Cardiovascular and All-Cause Mortality in Individuals With Diabetes MellitusImpaired Fasting Glucose, and Impaired Glucose Tolerance The Australian Diabetes, Obesity, and Lifestyle Study (AusDiab), Circulation 116:151–157.
-
38
The burden of disease and injury in Australia 2003, Australian Institute of Health and WelfareAIHW cat. no. PHE 82.
-
39
Psychiatrie and somatic comorbidities are negatively associated with quality of life in physically ill patientsJournal of Clinical Epidemiology 58:1090–1100.
-
40
Measuring quality of life in chronic illness: the functional assessment of chronic illness therapy measurement systemArch Phys Med Rehabil 83:S10–S17.
-
41
FRACP (Department of Endocrinology, Prince of Wales Hospital, NSW, Australia). Estimating the cost of complications of diabetes in Australia using administrative health-care-dataValue in Health, July, August.
-
42
A model to estimate the lifetime health outcomes of patients with Type 2 diabetes: the United Kingdom Prospective Diabetes Study (UKPDS) Outcomes Model (UKPDS no. 68)Diabetologia 47:1747–59.
-
43
Using an Economic Model of Diabetes to Evaluate Prevention and Care Strategies in AustraliaHealth Affairs 27:256–268.
-
44
Insights into the utilisation of health services in Australia based on linked administrative data. Occasional Papers, New series No 9Insights into the utilisation of health services in Australia based on linked administrative data. Occasional Papers, New series No 9, Canberra.
- 45
-
46
Model of Complications of NIDDM – Model Construction and AssumptionsDiabetes Care 20:725–734.
-
47
Model of Complications of NIDDM: Analysis of the Health Benefits and Cost-effectiveness of Treating NIDDM with the Goal of NormoglycemiaDiabetes Care 20:735–744.
-
48
Being better off but feeling worse: what’s happening to people in Australia?New Community Quarterly 2:3–7.
- 49
-
50
Social inequalities and the common mental disorders: a systematic review of the evidenceSocial Psychiatry and Psychiatric Epidemiology 38:229–37.
-
51
How effective are expert patient (lay led) education programmes for chronic disease?BMJ 334:1254–1256.
-
52
Modelling Our Future: Population Ageing, Health and Aged Care, 2007, International Symposia in Economic Theory and Econometrics, North Holland, AmsterdamModelling Our Future: Population Ageing, Health and Aged Care, 2007, International Symposia in Economic Theory and Econometrics, North Holland, Amsterdam.
-
53
Estimating the burden of disease and the benefits of prevention – commentaryEpidemiology 17:498–9.
-
54
Obesity as an independent risk factor for cardiovascular disease: a 26- year follow-up of participants in the Framingham Heart StudyCirculation 67:968–77.
-
55
Self-rated health and mortality: a review of twenty-seven community studiesJournal of Health and Social Behaviour 38:21–37.
- 56
- 57
-
58
The Australian Diabetes, Obesity and Lifestyle StudyAusDiab 2005: Tracking the Accelerating Epidemic: Its Causes and Outcomes, The Australian Diabetes, Obesity and Lifestyle Study, Melbourne.
- 59
- 60
-
61
Global Burden of Disease and Risk Factors, World Bank, WashingtonGlobal Burden of Disease and Risk Factors, World Bank, Washington.
-
62
APPSIM – Modelling Health: population ageing, health status and health outlays. NATSEM Working Paper No 13, University of CanberraAPPSIM – Modelling Health: population ageing, health status and health outlays. NATSEM Working Paper No 13, University of Canberra, Australia.
-
63
Glucose indices, health behaviours and incidence of diabetes in Australia: the AusDiab studyDiabetes Care 31:267–72.
-
64
Self-rated health: a predictor of mortality among the elderlyAm J Public Health 72:800–8.
-
65
Projecting coronary heart disease incidence and cost in Australia: Results from the Incidence module of the Cardiovascular Disease Policy ModelAustralian and New Zealand Journal of Public Health 23:11–19.
-
66
Measuring Quality of Life in Health, Churchill Livingstone, Elsevier, LondonMeasuring Quality of Life in Health, Churchill Livingstone, Elsevier, London.
-
67
Policy Implications of Ageing Populations: Introduction and Overview. OECD Working Paper no. 33Policy Implications of Ageing Populations: Introduction and Overview. OECD Working Paper no. 33, Paris.
- 68
-
69
Microanalysis of Socioeconomic Systems: A Simulation Study, Harper and Row, New YorkMicroanalysis of Socioeconomic Systems: A Simulation Study, Harper and Row, New York.
-
70
Microsimulation Policy Modelling Unit paper No MU 9402Statistical Reliability and Microsimulation: the Role of Sampling, Simulation and Estimation Errors, Microsimulation Policy Modelling Unit paper No MU 9402, University of Cambridge, UK.
-
71
How reliable are microsimulation estimates? An investigation of the role of sampling error in a UK tax-benefit modelJournal of Public Economics.
-
72
wealth and the pursuit of happinessJournal of the Royal Society for the Promotion of Health 127:2.
-
73
The importance of comorbidities in explaining differences in patient costsMedical Care 34:767–82.
-
74
An overview of methods for calculating the burden of disease due to specific risk factorsEpidemiology 17:512–9.
-
75
Low Income and Multiple Disadvantage: Analysis of the British Household Panel SurveyLondon: SEU.
-
76
Overweight and obesity from childhood to adulthood: a follow-up of participants in the 1985 Australian Schools Health and Fitness SurveyMedical Journal of Australia 186:458–460.
-
77
Modelling the socioeconomic status to health link in Australia: A dynamic microsimulation approachLAP Lambert Academic Publishing, Koln, Germany.
-
78
Multiple chronic diseases and quality of life: patterns emerging from a large national sampleAustralia, Chronic Illness 2007 3:202–218.
-
79
How do health, socio-economic status, education and family connections affect labour force status?Australian Journal of Labour Economics.
-
80
Cost-Benefit Model System of Chronic Diseases in Australia: to Assess and Rank Prevention and Treatment Options – Proposed Approach. Australian Centre for Economic Research on Health Research Report No 3, Australian National UniversityCost-Benefit Model System of Chronic Diseases in Australia: to Assess and Rank Prevention and Treatment Options – Proposed Approach. Australian Centre for Economic Research on Health Research Report No 3, Australian National University, www.acerh.edu.au/publications/ACERH_RR3.pdf.
-
81
Hospital Admissions by Socioeconomic Status: Does the ‘Inverse Care Law’ Apply to Older Australians?’Australian and New Zealand Journal of Public Health 30:467–73.
-
82
Changes in hospitalisation rates and costs – New South Wales, 1996–97 and 2000–01Australian Economic Review 39:391–408.
-
83
Health Inequalities Across Socioeconomic Groups: Comparing Geographic-Area-Based and Individual-Based IndicatorsPublic Health 119:1057–1150.
-
84
Cost–Benefit Model of Diabetes Prevention and Care: Model Construction. Assumptions and Validation, Technical Paper No 28University of Canberra: National Centre for Social and Economic Modelling.
- 85
-
86
Prevalence, Expenditures, and Complications of Multiple Chronic Conditions in the ElderlyArch Intern Med 162:2269–2276.
-
87
Preventing chronic diseases: a vital investmentPreventing chronic diseases: a vital investment, Geneva.
- 88
-
89
Global strategy for the prevention and control of non-communicable diseasesGlobal strategy for the prevention and control of non-communicable diseases, Geneva.
-
90
The Global Burden of Chronic Diseases: Overcoming Impediments to Prevention and ControlJAMA 291:2616–2622.
-
91
Dynamic Microsimulation Models: a Review and Some Lessons for SAGE. Discussion paper No 2London: ESRC-Sage Research Group.
Article and author information
Author details
Acknowledgements
Research for this paper was carried out as part of an Australian Research Council grant titled ―Chronic Disease Prevention and Treatment: Cost-Benefit Model Systems to Assist with Priority Setting‖ (DP0559650, 2005–2010).
Since preparation of this paper the model-system has been completed and validated. It is documented in Walker A, Butler J, Colagiuri S, 2011, Cost-Benefit Model System of Chronic Diseases to Assess and Rank Prevention and Treatment Options – HealthAgeingMod, Australian Centre for Economic Research on Health Research Report No. 10, Australian National University, www.acerh.edu.au/publicationsrrwp.php.
Publication history
- Version of Record published: December 31, 2011 (version 1)
Copyright
© 2011, Walker and Colagiuri
This article is distributed under the terms of the Creative Commons Attribution License, which permits unrestricted use and redistribution provided that the original author and source are credited.