Taxation of married couples in Germany and the UK: One-Earner Couples Make the Difference
- Germany Institute for Economic Research (DIW Berlin), Berlin
Abstract
A large body of literature points out that joint taxation of married couples with full income splitting (Ehegattensplitting) is an important reason for the relatively low labor force participation of married women in Germany. This paper investigates the relative gains of joint taxation for married couples by comparing effective tax burdens for three groups of tax units between Germany and the UK. Using the tax and benefit microsimulation model, EUROMOD, we compare effective average income tax rates for singles, one-earner couples, and two-earner couples in Germany and the UK. Applying the concept of effective tax rates, we go beyond marginal tax rates and account for effects of tax allowances and tax exemptions. We find that effective income tax liabilities are significantly lower for the majority of tax units in Germany compared to the UK, in particular for married couples. This is because married couples are taxed jointly in Germany, whereas the spouses are taxed individually in the UK. The benefits of joint taxation are particularly important for one-earner couples, and they can be found along almost the entire income distribution.
1. Introduction
International comparisons of tax liabilities are a crucial instrument for the analysis of tax systems, since they reveal feasible alternatives for tax reforms. In the public debate, the focus is usually on the tax rates. International comparisons of personal income taxes are difficult because tax schedules are typically progressive, i.e. the average tax rates increase with income. Moreover, there are significant differences in what, and how, income is taxed, depending, for example, on whether it is earned income, capital income, or income from benefit receipt, as well as with respect to the definition of taxable income. One further dimension that is important to consider when comparing the distributional effects of income taxation is the treatment of married couples. Whereas several countries treat married spouses as two different tax units (i.e. individual taxation), other countries tax married couples as a single tax unit (i.e. joint taxation). In a progressive tax system this difference is of central importance (Steiner & Wrohlich, 2004, or Immervoll et al., 2007). Germany (DE) is a prominent example for a country with joint taxation. In Germany married households jointly file their income and thus benefit from full income splitting (Ehegattensplitting)1 In contrast, in the United Kingdom (UK) married couples are in principle taxed like single households.
In this paper we propose a comparison of tax liabilities for these two countries in order to highlight the effect of the different treatment of married couples in the income taxation. We have chosen the UK and Germany for several reasons. First, despite several differences in the tax and transfer system (see, e.g. Haan, Myck, 2007, for a comparison of in-work tax credits in the two countries) the general progressive tax schedule is very similar in the two countries. Second the recent labor market performance in the two countries is similar, in particular female labor force participation in Germany is by now almost as high as in the UK (see OECD, 2013). And finally in the European context, Germany on the one hand and the UK on the other hand belong to the leading economies, which is why this comparison is particularly relevant.
A comparison of income tax schedules between countries is only meaningful if effective income tax liabilities across the distribution of gross incomes, as well as several socio-economic characteristics, are taken into consideration. For an empirical analysis of such effective tax liabilities, representative information on the distribution of the tax base is needed. Such analyses can be conducted using the European tax and benefit microsimulation model EUROMOD. Using EUROMOD, we compare effective average income tax rates for three groups of tax units, namely single households, one-earner married couples, and two-earner married couples, for Germany and the UK.
Merely looking at tax schedules and marginal tax rates (MTR) does not give a full picture of the actual tax liabilities. Comparison of tax burdens for the three groups between countries needs to be based on effective average tax rates (EATR). Applying the concept of effective tax rates, we go beyond marginal tax rates, as observed in the tax schedules, and account for effects of tax allowances, exemptions, deductions, tax credits as well as taxation rules for families, related to the number of children and marital status. For a comparable application of effective average tax rates, see, for example, Bach, Corneo, and Steiner (2012). Effective income tax progressivity in Germany is analyzed by Lang, Nörbaß, Stahl (1997). A comparative analysis of trends in national personal income tax systems across a large number of countries is conducted by Sabirianova Peter, Buttrick, and Duncan (2010). A comprehensive analysis of the entire tax-transfer treatment of couples in several European countries applying an older program version of EUROMOD is conducted by Immervoll et al. (2009).
There exists an important literature on the optimal taxation of married couples (e.g. Alesina et al., 2011, Boskin & Sheshinski, 1983, or Immervoll et al., 2011). In general these papers suggest that strict joint taxation of married households, which imposes higher marginal tax rates for the secondary earner, is not optimal. In contrast, given the higher elasticities of the secondary earner (in general the wife), Alesina et al. (2011), and Boskin and Sheshinski (1983) show that gender based taxation with lower marginal tax rates for the secondary earner would be optimal, i.e. more efficient in terms of labor supply. The academic discussion has in fact impacted the political debate. Even in Germany several parties now propose to abandon strict joint taxation with full income splitting and to gradually switching to individual tax schedules for married partners (see SPD, 2013, and Bündnis 90/Die Grünen, 2013).
Our empirical analysis complements the mainly theoretical literature by carefully demonstrating the different distributional effects of joint and individual taxation. Comparing effective tax liabilities for married couples between Germany and the UK, we find that tax burdens are, in general, significantly lower for the majority of tax payers in Germany, compared to the UK. The most important difference is found for one-earner married couples. This is largely because married couples are taxed jointly in Germany, whereas they are taxed like singles in the UK. Benefits of joint taxation are particularly large for one-earner couples, and they are found along almost the entire income distribution. Our results support the findings of previous studies that analyze the distributional and fiscal effects as well as the working incentives of joint taxation for married couples in Germany (Bach, Geyer, Haan, & Wrohlich, 2011, Dearing, Hofer, Lietz, Winter-Ebmer, & Wrohlich, 2007, or Steiner & Wrohlich, 2004).
2. Institutional background
Generally, the systems of taxation of married couples applied in the OECD countries today can be distinguished into three different approaches:
Individual taxation
Joint taxation with full income splitting
Joint taxation with limited income splitting
In the first system, the spouses are assessed individually for taxation, i.e. their incomes are taxed separately. Each of the spouses has an individual marginal tax rate that is independent from the other spouse’s income. This system is applied in the UK since 2001, which was when the UK abolished joint taxation of married couples. Before 2001, there was a Married Couples Allowance (MCA), under which an age-dependent tax-free allowance for the non-working spouses was granted. In 2000, this allowance was grandfathered in for couples with a spouse born before 1935, so that only these couples still benefit from the MCA today. See the EUROMOD country report for the UK for details (Sutherland, Tumino, & Zantomio, 2012).
In the second system, married couples are taxed jointly with full income splitting. The spouses sum up their individual incomes and divide them by two. The couple’s average taxable income is the tax base, and the resulting tax liability is then doubled. This averaging of incomes over spouses can significantly reduce the joint tax liability of the couple if there is relevant progressivity in the tax schedule. The tax relief compared to individual taxation is particularly great for couples with large income differences, in particular one-earner couples. It is smaller for two-earner couples, and it is zero in case both spouses have identical incomes. This system is applied in Germany for married couples (Ehegattensplitting) but not to cohabiting couples, which is why it can be labeled a marriage penalty (see Brewer et al., 2010).
In the third system, married couples are generally taxed jointly, but the extent to which their incomes are added up is limited. Systems two and three can potentially be extended to dependent children in the context of family taxation. In these systems, applied for example in France, children are also considered in the process of splitting taxable incomes across family members, i.e. incomes of children are assessable together with their parents’ incomes. The third system and the systems of family taxation are not subject to analysis in this paper. See Steiner and Wrohlich (2008), for simulations of these systems in the case of Germany.
3. Methodology
This section introduces the microsimulation model and the data used for our analysis. Additionally, the grouping of tax units is described, and the definitions of taxable income and gross income in the context of effective tax liabilities are explained, as applied in the simulations.
3.1 Simulations with EUROMOD
We use the European tax and benefit microsimulation model, EUROMOD. EUROMOD has been designed to compute incomes, contributory and means-tested benefits, social security contributions as well as income tax liabilities at the household level for all countries in the European Union. Given a bunch of socio-demographics in the underlying data, this enables the user to conduct distributional analyses of reforms to the tax and benefit systems and undertake comparisons in a cross-country environment.
EUROMOD is developed and maintained by the Institute for Social and Economic Research (ISER) at the University of Essex, in collaboration with national developers from EU member states2. For a general introduction to EUROMOD, see Sutherland and Figari (2013). EUROMOD is typically used for cross-country analyses of reforms to the tax and benefit systems, in particular with respect to relevant distributional effects, incentives for labor supply (e.g. Immervoll, Kleven, Kreiner, Saez, 2007), and fiscal effects (e.g. Dolls, Fuest, & Peichl, 2012, or Callan, Leventi, Levy, Matsaganis, Paulus, & Sutherland, 2011).
The 2012 version of EUROMOD is based on the common data set EU-SILC (European Survey of Income and Living Conditions) for all countries, except for the UK. For the UK, the Family Resources Survey (FRS) is used3. The EUROMOD data base contains 57,276 individuals in the UK and 28,845 in Germany. In the program version applied here, the underlying tax codes and benefit regulations are for 2010 in Germany and for 2011 in the UK, with the reference date for policies in case of both countries being June 30th. The purpose is to apply the most recent policy year available in the program version. For both countries, tax schedules have not changed significantly since then.
By using EUROMOD, we can display the empirical distribution of the effective income tax liabilities across gross incomes. We differentiate the empirical analysis by three groups of tax units, in order to illustrate the differential effects of taxation rules for families between the two countries:
Singles and individually-assessed couples, including cohabiting couples (“Individually assessed”)
Jointly-assessed couples, where only one of the spouses is working (“One-Earner Couples”)
Jointly-assessed couples, where both spouses are working (“Two-Earner Couples”)
We group the tax units according to their earned income (excluding capital income) and marital status, assuming that all married couples in Germany choose to be assessed jointly4. Couples are grouped into groups 2 and 3 according to the income from dependent employment as well as self-employment of the spouse with lower earnings. A couple is treated as “Two-Earner Couples” if both spouses have positive earned income. Generally, this restricts the entire analysis to tax units where at least one of the spouses has earned income, and thus excludes tax units with no income from self-employment or dependent employment, such as unemployed singles and couples where both spouses are unemployed.
The EU-SILC data for Germany and the FRS data for the UK turn out to provide a representative empirical base for the income distribution across the three groups of tax units, at least up to the 99th percentile5. For the top percentile there are some 200 observations in the case of Germany and more than 400 for the UK. The data contribute at least 40 observations to each of the three groups in the top percentile, for both Germany and the UK. However, the data do not allow an analysis of the top percentile in detail. For more details on the data, see EUROMOD country reports for the UK (Sutherland, Tumino, & Zantomio, 2012) and Germany (Ochmann & Fossen, 2011).
3.2 Deriving effective tax liabilities in EUROMOD
We explicitly analyze gross effective tax liabilities, i.e., we consider liabilities resulting directly from income taxation, which excludes most of the social benefits. We define the effective average tax liability as the personal income tax liability (including taxes on capital income and tax deductions, as well as, in the case of Germany, a solidarity surcharge of 5.5 percent on top of the tax liability) related to gross income. Gross income is defined as the sum of market incomes and benefits. Market incomes consist of (dependent and self-) employment income, income from capital, such as dividends, interest income, and income from renting out flats. Employment income includes all social security contributions (including employer contributions as well as imputed contributions for civil servants, and National Insurance Contributions in the case of the UK). Benefits comprise pensions, contributory unemployment benefits, family benefits (such as parental leave or maternity leave benefits), sickness benefits, as well as means-tested social benefits, such as non-contributory unemployment benefits, or social assistance, and non-means-tested benefits, such as child benefits.
Clearly, the choice of the income base for the effective tax liability as well as the measure for the liability itself are crucial for a proper cross-country comparison of tax-transfer systems. There are several possible choices, and the best choice should be determined by the particular purpose of the study of the tax incidence (see e.g. Immervoll, 2004, for a discussion). We apply a relatively broad income concept. The purpose here is to study the distribution of the liability of the income tax system relatively to the entire gross income of the tax unit, and not just the “labor tax wedge” liable on labor income (as e.g. in Immervoll, 2004). That is why we include means-tested benefits and employee as well as employer social security contributions in the income concept. Applying a broad income concept, in particular including several public benefits, furthermore enhances comparability of the effective tax liability between the different tax and transfer systems in the UK and Germany.
However, our measure of tax liability (the numerator in the EATR) does not include social security contributions in the case of Germany, and National Insurance Contributions in case of the UK. This approach is certainly debatable. Generally, the two countries apply distinct approaches of financing social security, either by taxes or by contributions. In Germany, most of the non-means-tested statutory benefits are financed by social security contributions, which are deductible from the income tax base. In the UK, in contrast, social security contributions per se play a minor role. Health care (NIC) and large parts of old-age provision are financed by the tax system, i.e. social security taxes and other taxes.
From a broader cross-county perspective, one could consider these differences in the calculation of effective tax liabilities. Social security contributions (SSC) could be added to the tax liabilities in the numerator, in an alternative approach (e.g. Immervoll et al., 2007). This would probably shift effective tax liabilities in Germany upwards, in particular for small and medium incomes. However, precisely accounting for such differences is rather intricate, the more so as differences in benefit levels should also be considered. Importantly, our main result on the gains of joint taxation for one-earner couples relative to two-earner couples in Germany compared to the UK should not be affected by the choice of excluding SSC. This is because the social security system in Germany, in addition to the tax system, privileges one-earner couples compared with two-earner couples in the context of family health insurance6.
All in all, EUROMOD allows us to simulate the adequately defined tax base and tax liabilities to be compared across the two countries. The income tax schedules programmed in EUROMOD consider the most relevant tax allowances and deductions. In the case of Germany, there is the basic tax-free allowance of the tax schedule (8,004 euros per year), a child allowance, a tax allowance for elderly people (over 64), a tax allowance for income from agriculture and forestry applied to all people working in the agricultural sector, a tax allowance for single parents, a lump-sum allowance for expenditures related to employment income, the tax-free allowance on capital income, as well as regulations for special expenses in the context of old-age provision that were reformed in Germany in 2010 and now allow for more comprehensive deductions of employee social security contributions. Among the general special expenses that are tax-deductible, alimony payments are considered. Among special expenses related to old-age provision, employee contributions to statutory pension insurance are considered, and among the other special expenses for old-age provision, employee contributions to statutory and private health as well as long-term care insurance are applied.
Several expenses are not considered due to a lack of detailed information in the EU-SILC data. Among general special expenses, church taxes as well as child care costs are not applied, as well as contributions to private old-age pension insurances among the old-age provision expenses (such as contributions to the subsidized private Riester pension scheme) and contributions to other insurances, such as personal liability insurances and wholesale life insurances. Furthermore, extraordinary expenses are not considered because these are not included in the SILC data7.
As a result, effective tax liability are probably slightly over-estimated in this analysis, in particular for the top incomes where higher tax expenses are applied in reality as opposed to the common lump-sum amounts applied here (for example, losses from corporate investments). However, this is probably concentrated among the highest incomes in the top percentile, which, as previously discussed, are not analyzed here due to the small number of observations in the top percentile (also see the results in Bach, Corneo, & Steiner, 2012).
For the UK, we consider the most relevant tax allowances and deductions. Among those allowances directly related to the tax schedule, we consider the basic tax-free allowance. Tax credits for working families with low income, such as the Working Tax Credit or the Child Tax Credit, are treated as means-tested social benefits and therefore are not considered as a tax liability. Thus, in the analysis they are included in gross incomes, and therefore only affect the denominator of the effective average tax rate. See the EUROMOD country report for the UK for details (Sutherland, Tumino, & Zantomio, 2012).
The resulting tax liability, related to the gross income, is interpreted here as effective tax liability. In the following section, its distribution is plotted across the distribution of gross income in the empirical examination. These plots show individuals, instead of tax units, in order to analyze the distribution of effective tax liabilities among jointly taxed couples. In case of jointly taxed couples in Germany, each spouse is displayed with their own income and their own share in the tax liability. For this purpose, we allocate tax liabilities among spouses according to each spouse’s taxable income share in the aggregate taxable income of the couple.
4. Income tax schedules in the UK and germany
A comparison of the income tax schedules for Germany and the UK reveals significant differences in both the schedule and in the resulting tax liability (Figure 1). The curves for the marginal tax rates differ greatly between the formula function in Germany and the step function in the UK. Figure 1 compares the schedules for individual taxation, i.e. singles and non-married couples in Germany.
While the British schedule starts after a tax-free allowance of about 7,475 euros8 of taxable income with a marginal tax rate of 20 percent on the first step, the German schedule increases after a tax-free allowance of 8,004 euros in a linear-progressive function relatively quickly, ranging from an initial tax rate of 15 percent up to a rate of more than 25 percent in the first progression zone (including the 5.5 percent solidarity surcharge)9. Thus, the marginal tax liability from the German schedule exceeds the liability from the British schedule at a taxable income of about 11, 500 euros.
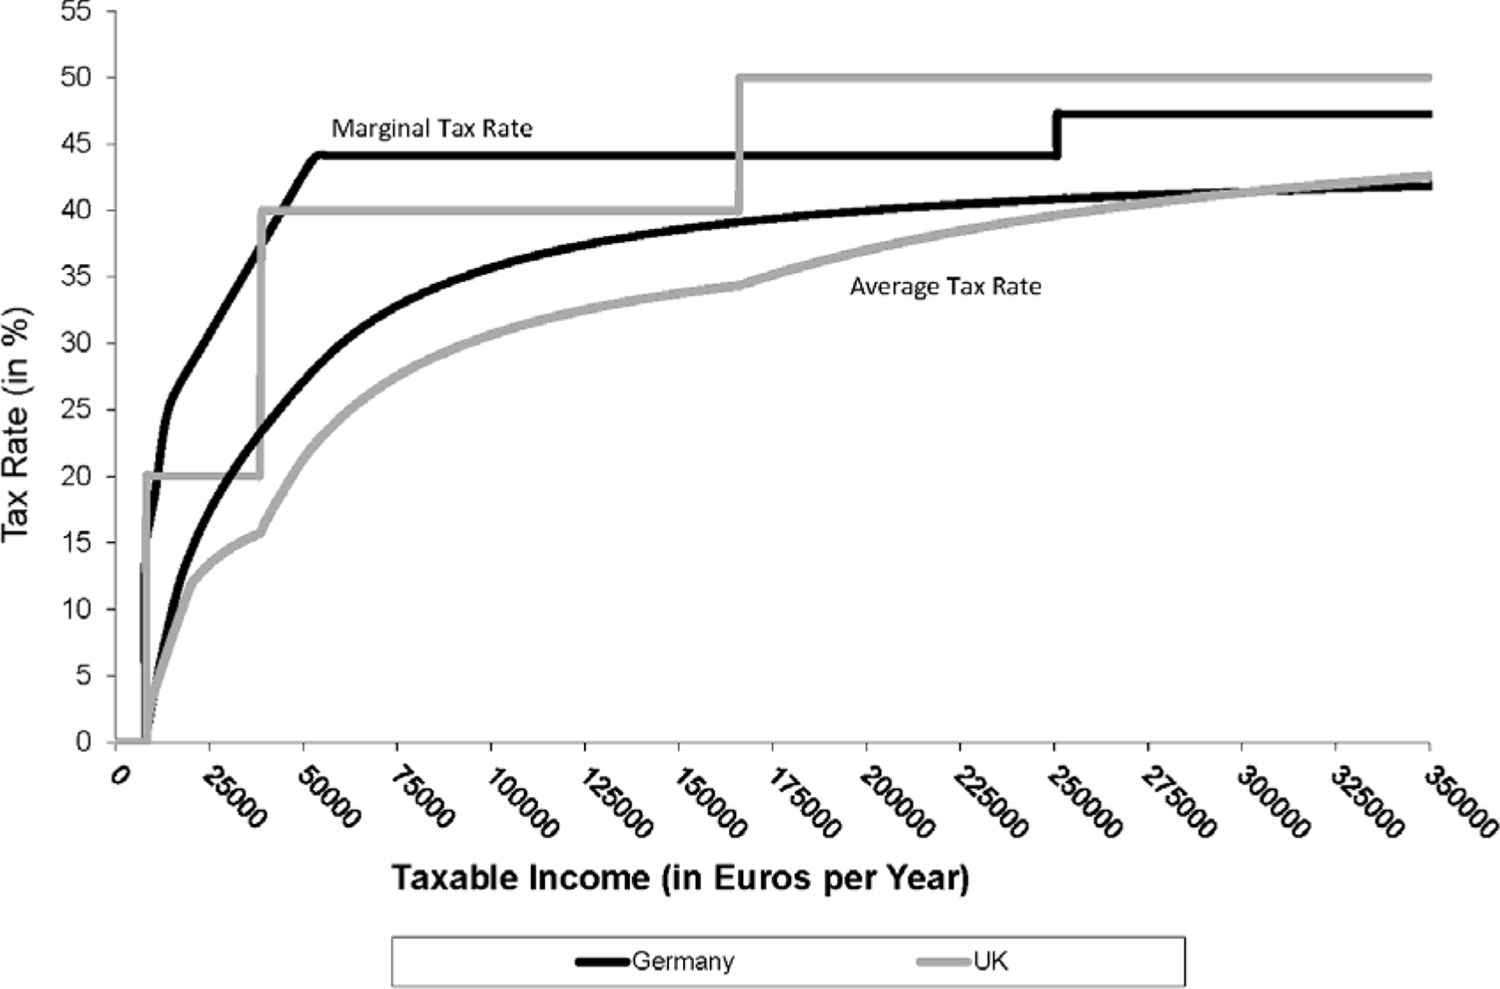
Income tax schedules (Singles, UK vs. Germany).
Note: Omitting reduction of the Personal Allowance above 100,000 GBP in the UK.
Source: German Income Tax Law (Einkommensteuergesetz, EStG) and British Income Tax Law (see HM Revenue and Customs under http://www.hmrc.gov.uk).
From there, the marginal liability in Germany continues to increase, whereas in the UK it remains constant at 20 percent until taxable income reaches about 39,000 euros; at which point the MTR in the UK jumps up to 40 percent. The rate at this income level is slightly higher in the UK than in Germany, because the German schedule is still in its second progression zone, which reaches, and maintains a tax rate of 44% at an income of about 53,000 euros. Thereafter, the schedule in Germany remains constant up to 250,000 euros taxable income. The UK tax rate increases to 50 percent10 at a taxable income of about 166,000 euros11.
Thus, the UK’s tax rate is higher than Germany’s for all incomes above 166,000 Euros. This holds true, even for incomes greater than 250,000 Euros, the point at which Germany imposes a so-called “rich tax”, an add-on to the top MTR, such that the MTR for these top incomes lies at slightly above 47 percent.
As a result of these MTRs, the tax schedule in Germany already exhibits much greater progressivity in the lower tails of the income distribution than in the UK. This becomes obvious when comparing the curves for the average tax rates between the countries (Figure 1). The average tax rate is higher in Germany across almost all of income distribution. Only for high incomes, above a taxable income of about 325,000 euros, is the average tax liability greater in the UK.
This picture of the average tax rates resulting directly from the income tax schedules neglects several relevant tax allowances and deductions, which reduce the tax liability for many tax units, in particular those with higher incomes, and importantly, which significantly vary between the two countries (such as lump-sum amounts for work-related expenses, child allowances, or special expenses for old-age provision). The most relevant of these allowances and deductions are accounted for using EUROMOD (also see the previous section). This allows us to derive effective average tax rates by relating the income tax liabilities to the gross income instead of to the taxable income (where the latter would again result in the average tax rates plotted in the schedules in Figure 1).
5. Results: effective tax liabilities in the UK and germany
In this section we present results on the effective tax liabilities from EUROMOD, comparing Germany with the UK. We start with empirical evidence across all groups of tax units, and then differentiate between the three groups of tax units as outlined in Section 2.1.
5.1 Across all taxpayers
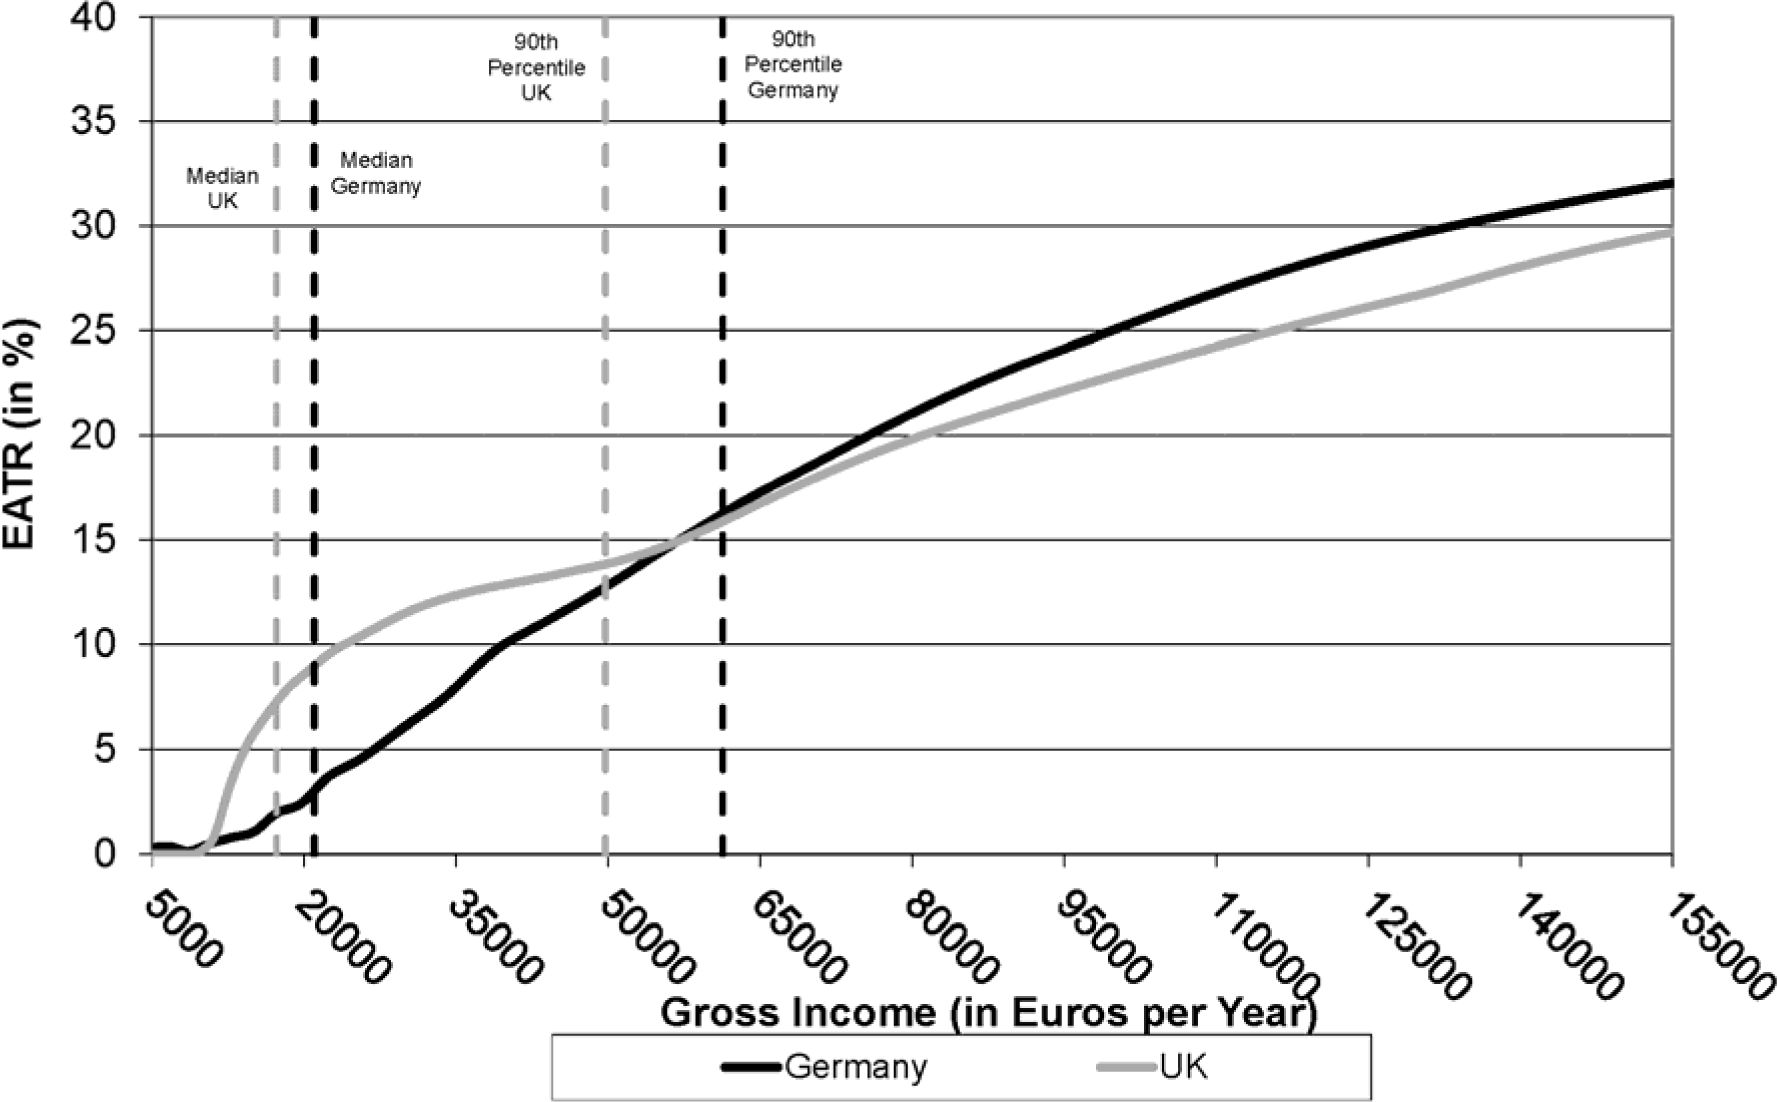
When comparing effective average tax liabilities between Germany and the UK, across the distribution of gross incomes (Figure 2), a picture evolves that can only partly be explained by the tax schedules from Figure 1.
In particular, at the center of the income distribution, it is apparent that the effective tax liability in the UK is much greater than in Germany. The effective average tax rate around the median gross income in Germany (20,970 euros) is about 2.5 percent. For the UK, the effective average tax rate is 7 percent at the median income (17,276 euros)12. At first sight, it may appear odd that the tax rate is so much higher in the UK. It should, however, be noted that employment incomes include all social security contributions (employee and employer). Social security contributions are much greater in Germany than in the UK. Also income-replacing benefits, such as contributory unemployment benefits, parental-leave benefits, or sickness benefits, are higher in Germany. Furthermore, pension income is fully taxable in the UK, whereas in Germany it is only partly taxable with a share depending on the retirement year, due to a long-term phasing in of full pension taxation. These are the main reasons for the significantly higher effective average tax rates at the lower and medium incomes. In the UK the effective average tax liabilities remain greater than in Germany until the 90th income percentile. At the 90th percentile, the effective average tax rate is about 15 percent in both countries.

Effective tax liability: average across all groups (UK vs. Germany).
Notes: Displaying individuals, not tax units. I.e., in case of jointly taxed couples, where at least one spouse has positive gross income, spouses are displayed separately, each of them with their individual gross income. EATR denotes effective average tax rates, which are defined in Section 3.2.
Source: EU-SILC data (UDB, 2008); FRS data (2008/09). Own calculations using EUROMOD.
The picture changes for higher incomes. Starting at a gross income of about 55,000 euros, the effective liability in Germany exceeds the liability in the UK, and it remains about 3-4 percentage points higher until the very highest incomes. As a result, on average over all groups of tax units together, the effective average tax liability is somewhat greater for the 10 percent of highest incomes in Germany than it is for those in the UK. This also means that for about 90 percent of all taxable individuals, the effective tax liability in Germany is less than in the UK, and for the majority it is significantly lower. This stands in great contrast to the picture that evolves from the simple comparison of tax schedules (Figure 1), where the suggestion is that average tax liabilities are greater in Germany, across large parts of both the lower and central parts of the income distribution. However, we have not seen the entire picture, since the presentation for all groups is not yet detailed enough to understand which group is responsible for these differences. We will come to that in the following subsection.
5.2 Cross-country comparison by groups of taxpayers
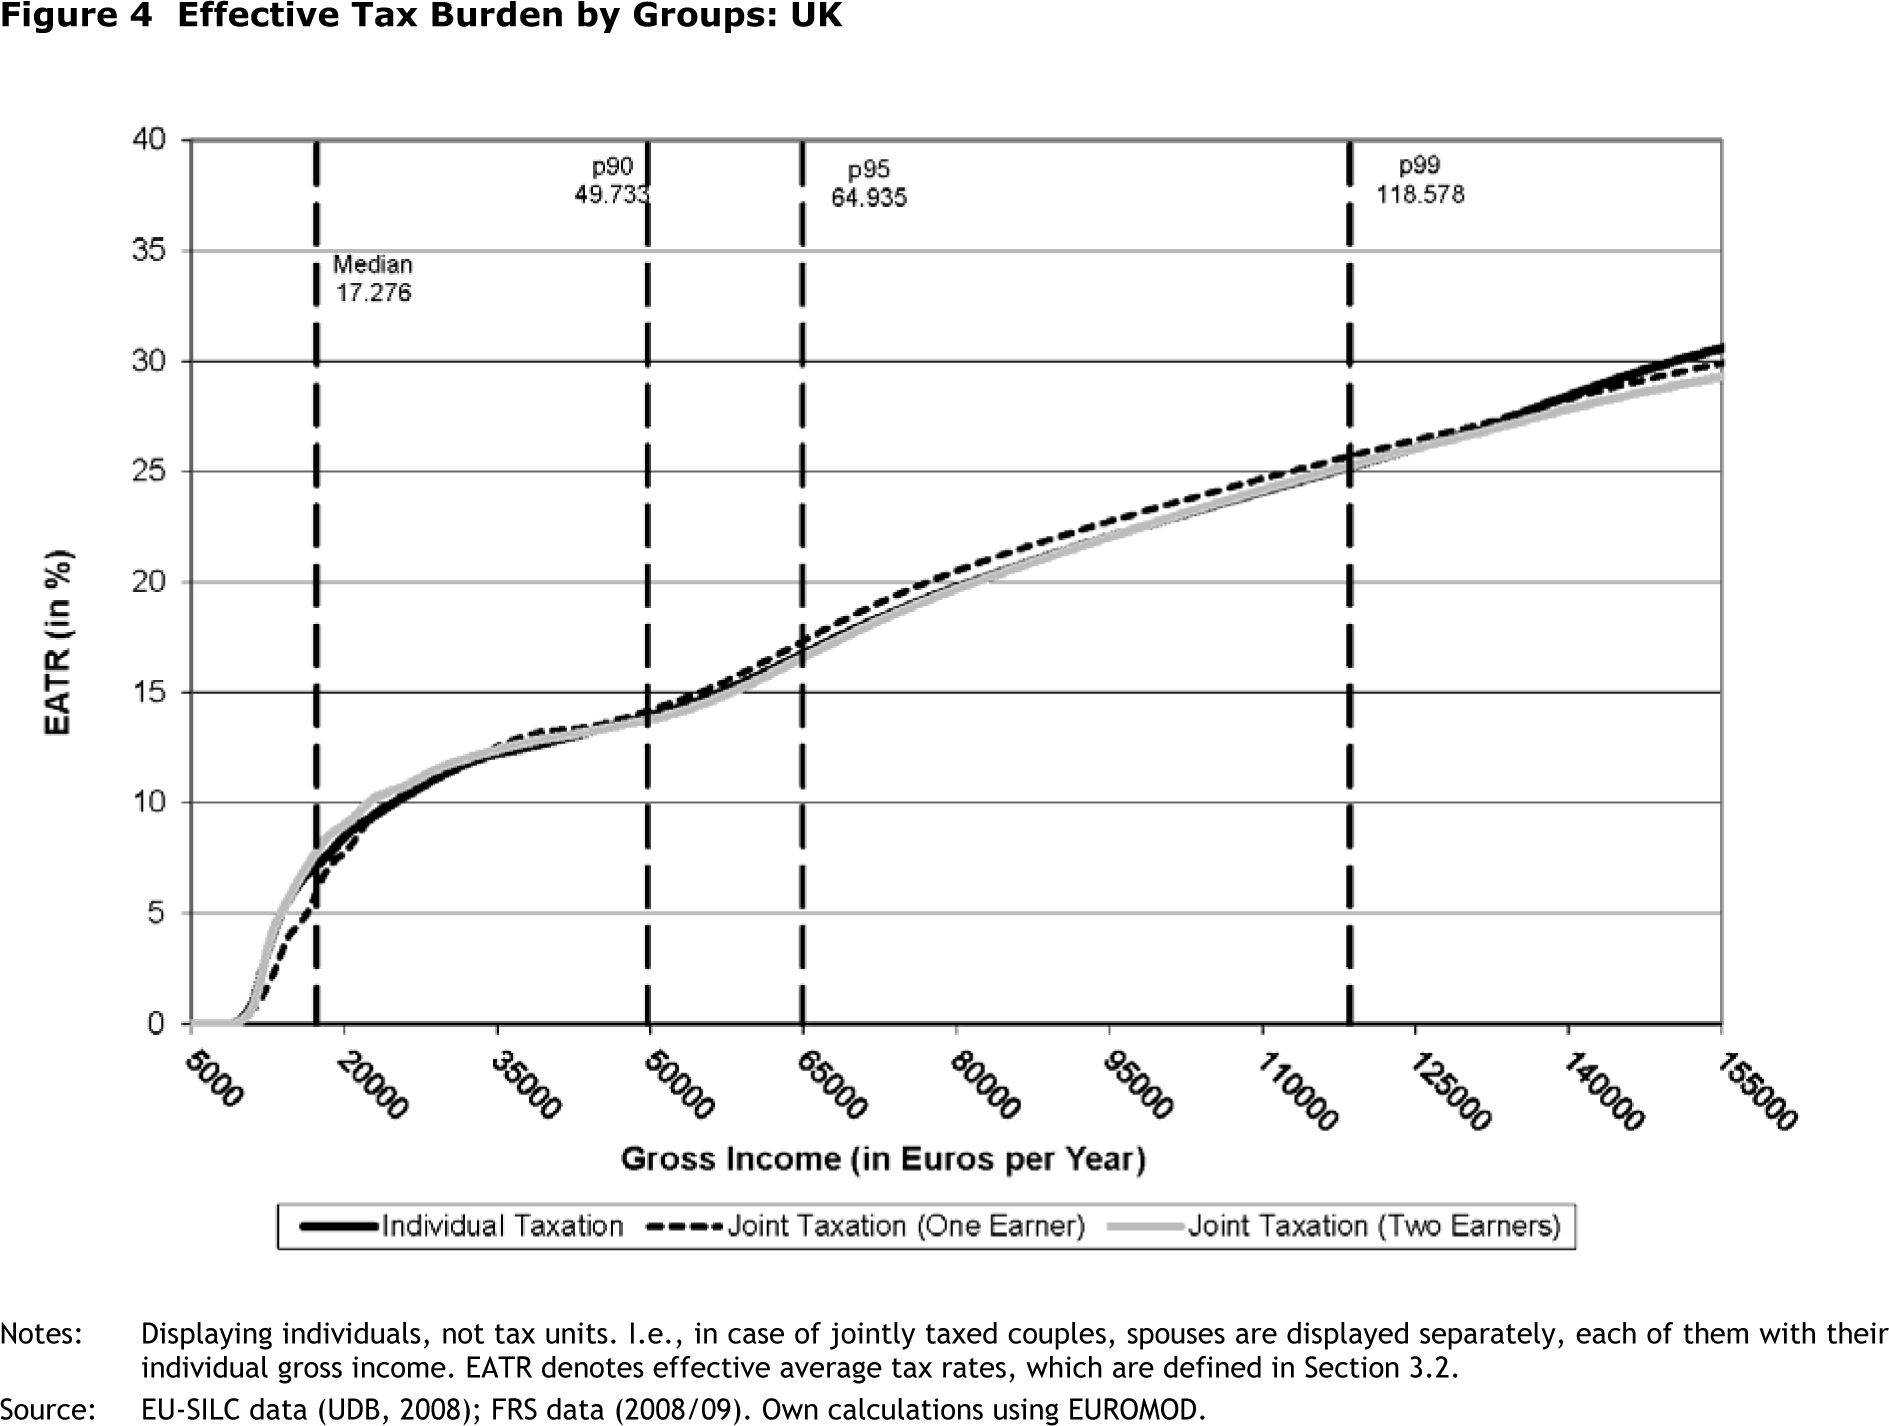
If we now look at the differentiate picture of the effective tax liabilities by the three groups of tax units (Figure 3), an explanation for the observed picture between the two countries (Figure 2) appears. While in the UK, due to individual taxation rules for almost all tax units, effective tax liabilities are nearly identical for all three groups (Figure 4 in the Appendix), there is great heterogeneity across German groups, which is because married couples in Germany apply joint taxation (Figure 3).
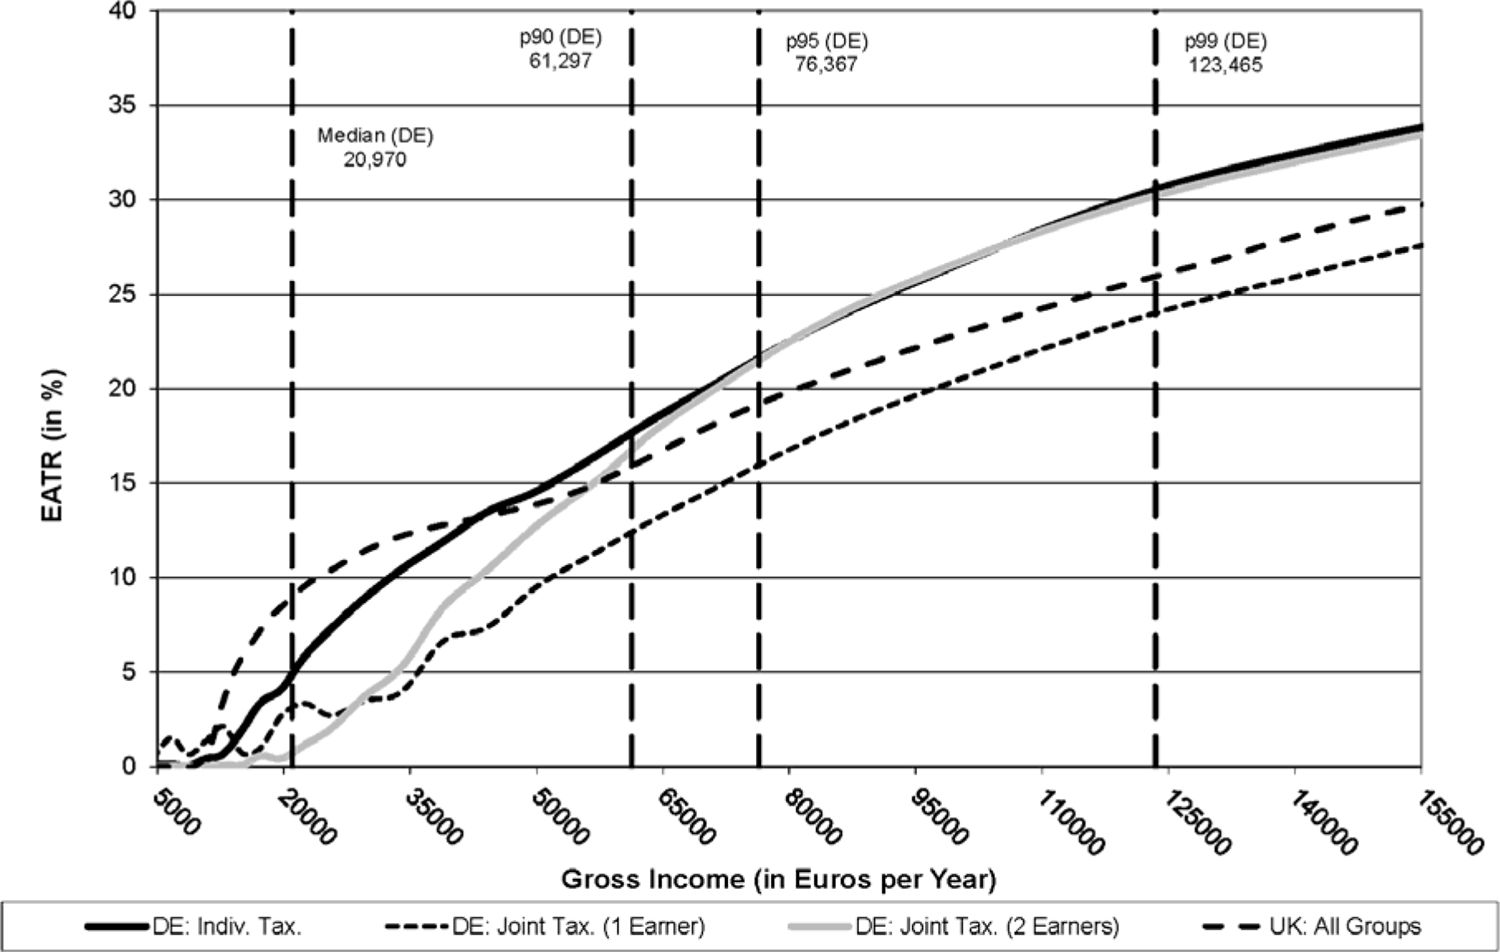
Effective tax liabilities by groups: United Kingdom (UK) vs. Germany (DE).
Notes: Displaying individuals, not tax units. I.e., in case of jointly taxed couples, spouses are displayed separately, each with their individual gross income. EATR denotes effective average tax rates, which are defined in Section 3.2.
Source: EU-SILC data (UDB, 2008); FRS data (2008/09). Own calculations using EUROMOD.
Figure 3 compares effective tax liabilities for the three groups in Germany and the average of all tax units in the UK. Among the three groups in Germany, effective average tax rates (EATR) are highest, already at the median income for the group of singles and individually-assessed couples (group 1 “Individually-assessed”). The significantly lower effective tax liabilities in Germany mainly stem from the inclusion of the tax-free employer social security contributions in the gross income concept. This remains until the 90th percentile. Comparing this to the UK, while EATRs are somewhat lower in Germany for large parts of the income distribution (until 40,000 euros) and only slightly greater for higher incomes, the overall picture between the two countries is comparable for this group. This is not the case for jointly taxed couples in Germany.
For the group of Two-Earner Couples in Germany, the effective tax liability between the 30th income percentile and the 90th income percentile is, on average, up to 6 percentage points lower than for the Individually-assessed. This group consists in this area of the income distribution of couples with large income differences. They benefit from the regulations of joint taxation because they have different incomes. Beyond the 90th percentile, these benefits vanish for this group because the tax schedule is largely flat in this area, such that there are no benefits resulting from progressivity anymore. Among the top incomes, the EATR is thus almost identical for the Two-Earner Couples and the Individually-assessed.
For the group of One-Earner Couples in Germany, the beneficiary effect from joint taxation is even more prominent (Figure 3). This group has a significantly lower EATR than the Individually-assessed across the entire upper half of the distribution (and also slightly below the median); it is up to 7 percentage points lower. Below the median, One-Earner Couples have, at some incomes, higher EATRs than the Individually-assessed and the Two-Earner Couples. The line for One-Earner Couples in Figure 3 fluctuates slightly at low incomes. This is a composition effect, and it is caused by some extraordinary One-Earner Couples. If low-income earners who are close to retirement, and potentially work on reduced hours, have spouses who are already retired, these married couples are grouped among the One-Earner Couples. The individual incomes of these earners are below the tax-free allowance. Still, they have EATRs greater than zero because their spouses have pension income, which becomes since 2005 increasingly taxable (see page 12). As Figure 3 plots each spouse separately with their share in the joint taxable income, the spouses on low individual income are placed in the lower tails of the income distribution.
In general, this picture nicely points out the merits of joint taxation regulations for One-Earner Couples in Germany. These rules generate the greatest tax benefits for One-Earner Couples and couples with highly unevenly distributed incomes, in particular in the upper tails of the income distribution.
Figure 3 also reveals the reason for the significantly lower EATRs in Germany compared to the UK in the average picture across all groups, which we saw earlier in Figure 2. The Two-Earner Couples in Germany face lower EATRs, up to 8 percentage points lower, than in the UK until the 90th income percentile. One-Earner Couples in Germany also face a lower EATR of up to 8 percentage points across almost the entire income distribution. For Two-Earner Couples in Germany the splitting effect of joint taxation vanishes at about the 90th income percentile because the tax rate is flat in this area, while for the One-Earner Couples these benefits remain until the 99th percentile, where the EATR is still almost 5 percentage points lower.
6. Conclusions
We show that Germans face higher effective tax liabilities when compared to UK citizens for two of the three groups analyzed. These are the Individually-assessed tax units and the jointly-assessed Two-Earner Couples tax units, but this is only true at the upper tails of the income distribution, beyond about 50,000 euros gross income. However, in this part of the income distribution only about 15 percent of all tax units are affected by these higher effective tax rates. For the majority of Individually-assessed tax units and jointly-assessed Two-Earner Couples, effective tax liabilities in Germany are not greater than in the UK, and for the latter group in the center and the upper part of the income distribution they are even slightly lower. Moreover, One-Earner Couples in Germany face significantly lower effective tax liabilities than in the UK, across almost the entire range of the income distribution. This is counter to the picture gained from a quick look at the tax schedules, where effects of joint taxation rules are not apparent.
Thus, it can be concluded that a proper empirical cross-country comparison of the effective income tax liabilities should account for the differentiated tax units and the effective tax rates imposed on them. In the case of Germany, the analyzed groups of tax units are defined by individual and joint taxation regulations. This is because in Germany joint taxation rules for married couples heavily distort the picture of tax liabilities across the income distribution, whereas in countries with pure individual taxation, such as the UK, this is not the case.
The merits of joint taxation for married couples have long been the subject of political debates in Germany. Moreover there is empirical evidence that these tax benefits for one-earner married couples are responsible, among others, for the relatively low participation of women in Germany’s labor force, as joint taxation significantly increases the marginal tax rates of married women, thereby lowering their incentives to work (Steiner & Wrohlich, 2004).
A conclusive policy recommendation would thus be to significantly reform joint taxation rules for married couples in Germany. This would significantly enhance female labor force participation (Bach et al., 2011). By completely abolishing joint taxation rules, or at least largely limiting the tax benefits for married couples, income tax revenue could be significantly raised. The additional revenue could be used to lower marginal tax rates at the lower end of the income distribution. The effects of bracket creep in the tax schedule, which result from nominal income increases over time and the progressivity of the tax schedule, could be mitigated on top of that (Bach, 2012).
Footnotes
1.
The US and France are other important examples for countries with joint taxation of married couples.
2.
This analysis uses EUROMOD program version F5.6, as of February 2012, which is a preliminary version to the publicly available version F6.0+.
3.
In the program version applied here, the FRS data used were collected in 2008/09 and incomes refer to the same period. The underlying EU-SILC data for Germany were collected in 2008 and incomes refer to 2007. For both countries, incomes have been uprated from income reference years to respective policy years, applying income-specific uprating factors. For details, see country reports for the UK (Sutherland, Tumino, & Zantomio, 2012) and Germany (Ochmann & Fossen, 2011).
4.
Married couples in Germany can choose between individual and joint taxation. Joint taxation yields a lower tax liability for the couple, with only very few exceptions. Individual assessment can be better for the couple if they have losses or incomes that are tax-exempt but would affect the couple’s marginal tax rate in case of joint taxation and if these incomes or losses are disproportionately allocated among the spouses. Thus, couples are only observed in a few exceptional cases opting for individual taxation, and it is usually assumed that all married couples in Germany choose joint taxation. See OECD (2013).
5.
In older versions of the EU-SILC data for Germany (2005–2007), there were much greater differences in the income distributions, in particular in the lower tails of the distributions, when compared for example to the SOEP data, which contains socio-economic micro panel data that is frequently used in national microsimulation models for Germany. See Frick and Krell (2010). There are, however, much fewer discrepancies for the 2008 SILC data used here, as a result of changes in the survey methodology. On the changes in the sampling method, see the country report for Germany (Ochmann & Fossen, 2011) and on the changes regarding the generation of the income variables see Vitlina, Sikorski, and Minkel (2012).
6.
In the context of family insurance in German public health insurance, contributions include insurance for spouses and children without any additional charge, as long as they don’t earn own income. Likewise, the public pension system includes survivors' benefits for spouses and children.
7.
The EUROMOD national developer team for Germany implemented imputations for several relevant tax allowances and expenses into the SILC data, using external information from tax statistics. Imputed allowances sum up to about 140 bn euros in 2007 and thus reduce simulated taxable incomes by about 10 percent. Thereby they reduce the over-simulation of taxable incomes compared to official tax statistics significantly to some remaining 7 percent. These imputations are, however, not considered yet in the version of the program underlying this analysis.
8.
British pounds have been converted to Euros in EUROMOD at an exchange rate of 0.902549, as of 30th June 2011.
9.
All values for marginal and average tax rates for Germany include the 5.5 percent solidarity surcharge levied on the tax liability.
10.
In spring 2012, the British parliament decided to lower this “50p” top tax rate to 45 percent starting in April 2013. See www.ifs.org.uk/projects/375 for details.
11.
In Figure 1, the reduction of the Personal Allowance above an income threshold in the UK has been omitted for the sake of illustration. It has, however, been considered in the simulations with EUROMOD. The Personal Allowance is tapered away by 1 GBP for every 2 GBP above a taxable income of 100,000 GBP.
12.
At first glance, both the median income levels and the effective average tax rates appear fairly low, in general in both countries. Regarding income levels, it should be noted that the distribution of gross incomes includes all individuals who have income they earned themselves or have a partner with earned income, so that there is a significant number of individuals with zero gross income. Regarding the tax rate level, it should be noted that these are effective average tax rates. At a gross income of 20,000 euros, for example, the taxable income is about 10,000 euros, the marginal tax rate is about 18 percent, but the average tax rate is only about 5 percent. Relating the resulting tax liability to gross income, an effective average tax rate of about 2.5 percent comes out.
Appendix - results

Effective tax burden by groups: UK.
Notes: Displaying individuals, not tax units. I.e., in case of jointly taxed couples, spouses are displayed separately, each of them with their individual gross income. EATR denotes effective average tax rates, which are defined in Section 3.2.
Source: EU-SILC data (UDB, 2008); FRS data (2008/09). Own calculations using EUROMOD.
References
-
1
Gender-Based Taxation and the Division of Family ChoresAmerican Economic Journal: Economic Policy 3:1–40.
-
2
Abbau der kalten Progression: Nicht die einzige Herausforderung beim Einkommensteuertarif. DIW Wochenbericht No.12/2012DIW Berlin: German Institute for Economic Research.
- 3
-
4
Reform des Ehegattensplitting: Nur eine reine Individualbesteuerung erhöht die Erwerbsanreize deutlich. DIW Wochenbericht No.41/2011DIW Berlin: German Institute for Economic Research.
-
5
Optimal tax treatment of the family: Married couplesJournal of Public Economics 20:281–297.
-
6
The Mirrlees Review: Dimensions of Tax DesignMeans-testing and tax rates on earnings, The Mirrlees Review: Dimensions of Tax Design, eds, The Institute for Fiscal Studies, London.
-
7
Zeit für den grünen WandelTeilhaben, Einmischen, Zukunft schaffen. Wahlprogramm. Beschlossen auf der Bundesdelegiertenkonferenz vom, 26–28. April 2013, in, Berlin.
-
8
The distributional effects of austerity measures: A Comparison of six EU countries. EUROMOD Working Paper Series: EM 06/11The distributional effects of austerity measures: A Comparison of six EU countries. EUROMOD Working Paper Series: EM 06/11.
-
9
Why are mothers working longer hours in Austria than in Germany? A comparative microsimulation analysisFiscal Studies 28:463–495.
-
10
Automatic stabilizers and economic crisis: US vs. EuropeJournal of Public Economics 96:279–294.
-
11
Measuring Income in Household Panel Surveys for Germany: A comparison of EU-SILC and SOEP. SOEP PapersMeasuring Income in Household Panel Surveys for Germany: A comparison of EU-SILC and SOEP. SOEP Papers, DIW Berlin.
-
12
Apply with Caution: Introducing UK-Style In-Work Support in GermanyFiscal Studies 28:43–72.
-
13
Average and marginal effective tax rates facing workers in the EU: A micro-level analysis of levels, distributions and driving factors. EUROMOD Working Paper Series. No. EM6/04Average and marginal effective tax rates facing workers in the EU: A micro-level analysis of levels, distributions and driving factors. EUROMOD Working Paper Series. No. EM6/04.
-
14
Welfare reform in European countries: A microsimulation analysisThe Economic Journal 117:1–44.
-
15
An Evaluation of the Tax-Transfer Treatment of Married Couples in European Countries. EPRU Working Paper Series 08-03, Economic Policy Research Unit (EPRU)University of Copenhagen. Department of Economics.
-
16
Optimal tax and transfer programs for couples with extensive labor supply responsesJournal of Public Economics 95:1485–1500.
- 17
- 18
-
19
Taxing Wages 2011–2012 - Special Feature: Average personal income tax rate and tax wedge progression in OECD countriesOECD Publishing.
-
20
Wie progressiv ist Deutschland? Das Steuer- und Transfer system in Europāischen Vergleich“. EUROMOD Working Paper No. EM 01/08Wie progressiv ist Deutschland? Das Steuer- und Transfer system in Europāischen Vergleich“. EUROMOD Working Paper No. EM 01/08.
-
21
Global Reform of Personal Income Taxation, 1981-2005National Tax Journal 63:447–478.
-
22
Das Wir entscheidet. Das Regierungsprogramm 2013-2017. Beschlossen am 11. April in AugsburgDas Wir entscheidet. Das Regierungsprogramm 2013-2017. Beschlossen am 11. April in Augsburg.
-
23
Household taxation, income splitting and labor supply incentives. A microsimulation study for GermanyCESifo Economic Studies 50:541–568.
-
24
Introducing Family Tax Splitting in Germany: How Would It Affect the Income Distribution, Work Incentives, and Household Welfare?Fiscal Studies 64:115–142.
-
25
EUROMOD: the European Union tax-benefit microsimulation modelInternational Journal of Microsimulation 6:4–26.
-
26
EUROMOD Country Report for the United Kingdom, 2006–2011ISER at the University of Essex.
-
27
Redistributive effect and progressivity of taxes: An international comparison across the EU using EUROMOD. EUROMOD Working Paper No. EM 05/04Redistributive effect and progressivity of taxes: An international comparison across the EU using EUROMOD. EUROMOD Working Paper No. EM 05/04.
-
28
Generierung der Einkommensvariablen in der deutschen EU-SILC-Erhebung LEBEN IN EUROPA. Wirtschaft und Statistik 2/2012German Federal Statistical Office.
Article and author information
Author details
Acknowledgements
This paper greatly benefited from valuable discussions with audiences at the 2nd EUROMOD Microsimulation Research Workshop in Bucharest in October 2012. We would like to thank the EUROMOD team at ISER for providing access to a preliminary program version (F5.6). We also thank Adam Lederer and anonymous referees for helpful comments. The usual disclaimer applies.
Publication history
- Version of Record published: December 31, 2013 (version 1)
Copyright
© 2013, Haan
This article is distributed under the terms of the Creative Commons Attribution License, which permits unrestricted use and redistribution provided that the original author and source are credited.