Distributional effects of the forthcoming finnish pension reform – a dynamic microsimulation approach
- Finnish Centre for Pensions, Finland
- Article
- Figures and data
-
Jump to
- Abstract
- 1. Introduction
- 2. Background of the reform
- 3. The 2017 reform in detail
- 4. Model assumptions
- 5. Microsimulation results
- 6. Conclusions
- Footnotes
- A. The model structure
- A. Current earnings-related pension rules in a nutshell
- A. Earnings related pension by education
- References
- Article and author information
Abstract
The Finnish pension system consists of earnings-related pensions (almost 90% of the total pension expenditure) and the national pension. The earnings-related pension system will undergo a major reform in 2017. The main objective of the reform is to ease the burden on public finances by extending working lives.
The earliest eligibility age for old-age pension will gradually rise from the current 63 years to 65 years by the 1962 birth cohort. After that, the earliest eligibility age will be linked to the growth in life expectancy. The age-specific accrual rates will be unified after a transition period. The early retirement schemes will also be reformed. The level of the disability benefits will improve.
The forthcoming reform has been analysed using the ELSI microsimulation model of the Finnish Centre for Pensions. The model is based on administrative register data and it covers both the earnings-related and the national pension system of Finland. ELSI is a model with dynamic ageing without behavioural adjustments. The behavioural changes resulting from the reform have been taken into account explicitly: the age-gender-specific behaviour is obtained from our macro model using a micro-macro link. The differences in transition probabilities between educational groups are extrapolated from the register data.
The reform indicates changes in income distribution. We analyse the impacts of the reform on working lives, the pension level as well as the pension distribution. The results are presented by gender and educational level.
1. Introduction
The most important part of the statutory pension system in Finland is the earnings-related pension system, which corporates approximately 90 per cent of the total pension expenditure. In practice, the earnings-related pension system is a pillar I system with some pillar II features. In addition, there is a pillar I national pension system and a guarantee pension system that supplement earnings-related pensions for those who have accrued no or only a relatively small earnings-related pension. It has been suggested that the limited role of private pensions (III pillar) is due to the fact that there is no ceiling in the earnings-related pension scheme (Andersen et al. 2014, p. 124).
The Finnish pension system was last reformed in 2005. As a result of that reform, some early retirement benefits were discontinued, while the flexible retirement age and the life expectancy coefficient were introduced (see appendix A.2). The effects of these reforms are currently starting to show (e.g. Hietaniemi et al. 2006; Lassila and Valkonen 2007). The Finnish pension system is facing its next major reform in 2017. The main changes include increasing the earliest eligibility age for old-age pension and harmonizing the age-specific accrual rates. There will also be some changes to the early retirement options. For example, the new disability pensions will improve, the part time pension will be discontinued, new partial old-age pension1 and years-of-service pensions will be introduced. Most of the changes will have a direct impact only on earnings-related pensions. However, the age limits of the national pension system will also change when the earliest eligibility age in the earnings-related pension system rises.
In this paper, we analyse the reform using the ELSI microsimulation model developed by the Finnish Centre for Pensions. Our LTP (Long Term Projection) macro model (Risku et al. 2014) has also been used for modelling the reform (Finnish Centre for Pensions 2014, Kautto and Risku 2015)2. In aggregate level, the two models give essentially analogous results. The added value of the microsimulation model is that we can obtain distributional information on the pension levels and replacement rates and receive information on the different impacts on various population sub-groups.
ELSI is based on administrative register data. It is a dynamic microsimulation model in the sense of dynamic aging (discrete-time/cross sectional aging). The model contains functional modules for population dynamics, earnings, earnings-related pensions, national pensions and income taxation. It is also possible to run pension calculation for example cases. The sample size contains 250,000 individuals in the starting year 2008. New 18-years-olds and immigrants are added to the sample annually. A typical simulation run covers years 2009–2080.
The model does not contain any behavioural equations. However, some of the behavioural adjustments resulting from the rising age limits are modelled explicitly in the macro model. The age-gender specific behaviour is obtained from the macro model using a micro-macro link. The differences among different educational groups are estimated from the register data. The ELSI model is described in detail in the report Tikanmäki et al. 2014. Since then, we have added new modules for national and guarantee pensions as well as for income taxation. The updated structure of the model is described in appendix A.1.
This paper is mainly based on chapter 6 of the report Kautto and Risku 2015 (in Finnish), with some extensions and updates. Some details of the 2017 pension reform were specified after the report was finished. However, the main lines of the reform and of the results are the same as in that report. In this paper, we have extended our model to national pensions in order to get more accurate results on the impacts on the income distribution of the retired population.
2. Background of the reform
The main objectives for the reform were to increase the employment rate by postponing the retirement and to ease the sustainability gap3 of the public finances. The reform was also addressed to improve the sustainability of the pension system and adequacy of the pensions as well as to guarantee intergenerational fairness. No other primary goals for income redistributions have been set, but impacts on these will come on the side. Naturally, the labour market organizations that took part in the negotiation had their own goals.
In addition to the Finnish Centre for Pensions (Finnish Centre for Pensions 2014, Kautto and Risku 2015), the reform has been analysed in detail also by the Research Institute of the Finnish Economy (Lassila et al. 2015). Their pre-reform study in English on income distribution, public finances and working lives can be found in Lassila and Valkonen 2014.
The sustainability gap (S2 indicator) is estimated to be at around 5 per cent of GDP at an annual level in 2019. Taking into account the pension reform that is scheduled for implementation as of the beginning of 2017 the sustainability gap in public finances will be reduced by approximately one percentage point (Ministry of Finance 2015a).
Working lives have been extended in recent years. Working life is usually analysed in population sub-groups. Recent figures for people retiring on an old-age pension in 2012 show that their median working life spans 38.6 (males 39.4, females 37.7) years (Pension indicators 2014). Regardless of the pension scheme, the median working life of people with a higher educational level is longer than that of people with a lower educational level. It has been estimated that the median working life of the less educated (ISCED 2) retiring on an old age pension is 35.4 years, whereas the figure for those with a higher education level (ISCED 5a) is 36.5 years (Järnefelt et al. 2014, p. 47).
When comparing with other countries, we have to rely on Eurostat statistics (Table 1). Working lives are somewhat shorter in Finland than in other Nordic countries. In comparison to Denmark, Sweden and Norway, Finnish working lives are roughly 2–4 years shorter.
Average length of expected working life in some European countries, years4.
| Country | Male | Female | Total |
|---|---|---|---|
| EU 28 | 37.7 | 32.5 | 35.2 |
| Denmark | 40.3 | 37.6 | 39.0 |
| Finland | 37.8 | 36.6 | 37.2 |
| Sweden | 42.1 | 39.6 | 40.9 |
| Iceland | 47.2 | 43.8 | 45.5 |
| Norway | 40.6 | 38.3 | 39.5 |
-
Source: Eurostat
The reform, which will take effect in January 2017, is based on the Agreement on 2017 Earnings-Related Pension Reform (2014) between the central labour market organizations. The government has proposed a bill on the reform which Parliament is scheduled to pass in the fall of 2015 (Prime Minister Sipilä’s Government Program 27 May 2015).
3. The 2017 reform in detail
In the following, we will describe the main changes following the reform. The currently valid rules are described in appendix A.2. The earliest eligibility age for old-age pension will rise by 3 months per birth cohort, from 63 years (1954 birth cohort) to 65 years (1962 birth cohort). From the 1965 birth cohort onward, the earliest eligibility age will be linked to the growth in life expectancy.
The upper age limit for pension accrual is now 68 years. It will be 69 years for birth cohorts 1958– 1961 and 70 years as of the 1962 birth cohort. A new target retirement age will be introduced for each birth cohort.5
Although the pensionable age will be linked to the growth in life expectancy, the life expectancy coefficient will remain. However, the increase in the pensionable age above 65 years6 will be taken into account when calculating the coefficient. Thus, the cutting effect of the coefficient will be smaller than it would be without the reform.
Currently, the pension accrual rates are age-specific, so that older employees accrue more pension rights than do younger employees. Currently the income that accrues a pension equals the salary from which the employee’s pension contribution has been deducted. As a result of the reform, the accrual rates will be unified to 1.5 per cent, following a transition period. Until the year 2025, the accrual rate for 53–62-year-olds will be 1.7 per cent. In addition, the employee’s pension contribution will not be deducted from the pensionable earnings after the reform. Effectively, these two changes combined mean that the accrual rates for the under 53-year-olds will improve while those for the above 53-year-olds will deteriorate.
Currently there is a so-called accelerated accrual rate of 4.5 per cent for those who have deferred their retirement past the earliest eligibility age for old-age pension. This accelerated accrual rate will be replaced by the regular accrual rate of 1.5 per cent, combined with an actuarial deferral rate of 0.4 per cent per month.
From 2017 onward, pension will accrue already as of age 17, (in contrast to the current lower age limit of 18 years).
The disability pensions will improve, because the exit age of the projected pensionable service will be the earliest eligibility age for retirement in the year of occurrence of the disability instead of current 63 years. However, after 2027, the life expectancy coefficient will be applied to the entire disability pension instead of to the part accrued by the time of retirement. This will mitigate the increase of the disability pensions starting from the year 2027.
In addition to the disability pension, a years-of-service pension will be introduced. It may be granted to persons aged 63 who have worked for at least 38 years mostly in strenuous and wearing work. The required reduction in work capacity is rather minor.
The current part-time pension based on the final wage will be replaced by an actuarial partial old-age pension. The age limit for the partial old-age pension will be 61 years for people born in 1963 or earlier and 62 years for those born in 1964 or later. The partial old-age pension can amount to either 25 or 50 per cent of the accrued pension, with an actuarial reduction. The conditions for working less and working at all will be abolished.
According to current legislation, unemployed people born in 1957 or later, whose earnings-related unemployment period (of approximately 2 years) ends at the age of 61 or above, will get additional earnings-related unemployment benefits until they reach the retirement age. This age limit will increase to 62 for people born in 1961 or later.
Some of the amendments included in the reform were suggested by Barr (2013) in his evaluation of the Finnish pension system. These include linking the earliest eligibility age to the growth in life expectancy, allowing for more flexible partial retirement, changing the compensation mechanism for deferring retirement to a more actuarial one and harmonizing the age-specific accrual rates. Barr further suggested that the terminology should be revised so that the earliest eligibility age would not become the social norm of retirement. Introducing the target retirement age is an attempt to fulfil this objective.
In addition to the pension benefit rules, the reform contains several updates to the financing rules of earnings-related pensions. However, as these changes do not have direct effects on the results of this paper, they have been omitted.
4. Model assumptions
The impact of the reform is analysed using two different projections. The baseline projection is based on the current pension rules. The reform projection is a modification of the baseline projection, where we have taken the impacts of the reform into account. The difference between the two projections is interpreted as the impact of the reform. Most of the assumptions are common for both projections.
The base population in ELSI is the socially insured adult population of Finland. The development of the base population follows the official population projection of Statistics Finland until 2060. The most important assumptions of the population projection are the following:
the total fertility rate is 1.82,
net immigration is 17,000 persons each year,
the decreasing mortality trend of 1987–2011 is extended for the projection period.
Age and gender specific retirement rates are expected to develop as in LTP macro model (Finnish Centre for Pensions 2014; Kautto & Risku 2015). In the baseline scenario under current legislation, we have preserved the observed differences in transition probabilities among the educational groups.
Even though we get the age and gender specific retirement rates from the macro model, we have to define explicitly what the differences in transition probabilities among the educational groups are, when the age limits increase. We have decided to use the best available statistical information to do this. We have assumed that, for over 63-year-olds, the differences between educational groups in the retirement rate for disability pension will be the same as for 60–62-year-olds observed in the past. These figures are also applied for the new years-of-service pensions. The same methodology is applied for old-age retirement for over 68-year-olds, where the differences among the groups are estimated from the historical figures for 63–67-year-olds. In practice, these assumptions mean that the higher the education level, the lower the age-specific retirement rate. This phenomenon is highlighted in the case of the disability pension.
The age and gender specific retirement rates for partial old-age pension are also obtained from the LTP macro model. In general, the new partial old-age pension is expected to be much more attractive because of abolished conditions on labour market participation. We have used the historical data of the part-time pension for the differences in the retirement rates among the various educational groups for partial old-age pension.
The long-term inflation assumption is 1.7 per cent, and the wages are expected to grow by 1.6 per cent in real terms. The short-term behaviour follows the short-term economic forecast of the Finnish Centre for Pensions per April 2015.
Our simulation utilizes information on the educational background of individuals. Annual data on individuals’ highest education level has been added to the primary data. In the presentation of the results, we have divided the population into two groups: people with a secondary or lower degree (ISCED 0–3) and people with a Bachelor’s or higher degree (ISCED 4–6).
5. Microsimulation results
Most of the results are represented for 75-year-old people who live in Finland and have an earnings-related pension in payment7. Unless otherwise explicitly mentioned, we have considered only earnings-related pensions, excluding survivors’ pensions. In some cases, we have also included national and guarantee pensions.
When considering the results by educational groups, we have excluded immigrants entering Finland during the simulation period. The information on the immigrants’ educational level is not completely comparable to that of the native population. However, immigrants are included in the figures covering the whole population.
The ELSI model is based on the Monte Carlo simulation. This means that there is some random noise in the results. In addition, in the projection, the age limits are always in full years although, in reality, the age limits increase on a monthly basis. Hence, one should not make too strong statements based on single figures.
5.1 Impact on working lives and time in retirement
In the following, we consider the impact of the reform on the length of working lives in the future. The working life begins at the age of 18 and is based on working days for which pension accrues. The lengths of working lives in the baseline projection are compared to those in the reform projection. The most important factor driving the results is the gradually increasing retirement age. The assumptions regarding the behavioural responses on the rising age limits also have a considerable effect on the results.8
We have used register-based information on the insured working history of each individual included in the sample until 2007 and simulated working years as of the year 2008. This means that there are some differences in how working lives are measured before and after the year 2008. Primarily, one should only make conclusions of the effects of the reform. In general, the younger cohorts are better educated than the older ones. This phenomenon has some selection impact between the two educational groups. However, the decreasing trend in the working lives of the lower educational group may be a consequence of the difference in data between the observed past and the simulated future.
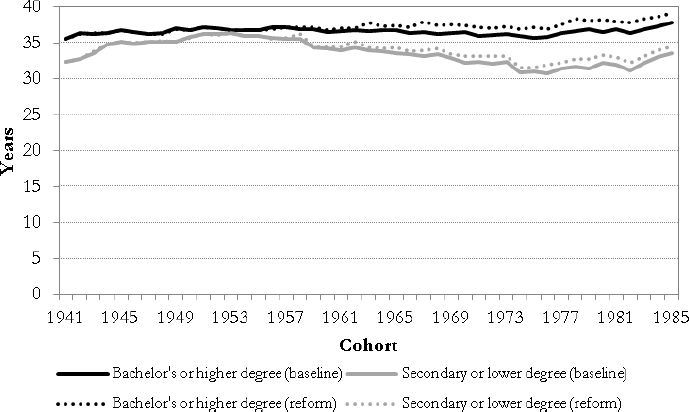
As a result of the reform, the working lives will be extended by 1–2 years as of the 1970 birth cohort. The working lives of the highly educated will be extended more than the working lives of those in the lower educational group (Figure 1). The difference in the impact between genders is negligible.

Average working life by education, median length in years.
In Table 2 we present the impact of the reform for the lower, median and upper quartiles (25%, 50% and 75% percentage points respectively) and the mean of the length of working life distribution. It turns out that the long working lives are expected to grow slightly more than the shorter ones.
Difference in working life of 75-year-olds by gender Difference of reform to baseline in years.
| Gender/Cohort | P25% | P50% | P75% | Mean |
|---|---|---|---|---|
| Male 1960 | −0.1 | 0.2 | 0.3 | 0.1 |
| Male 1970 | 0.5 | 0.8 | 1.7 | 0.9 |
| Male 1980 | 1.0 | 0.9 | 1.2 | 1.2 |
| Male 1990 | 1.0 | 1.0 | 1.0 | 1.2 |
| Male 2000 | 1.0 | 2.0 | 2.0 | 1.4 |
| Female 1960 | 0.3 | 0.4 | 0.7 | 0.5 |
| Female 1970 | 0.9 | 0.9 | 1.1 | 1.0 |
| Female 1980 | 1.1 | 1.4 | 1.8 | 1.5 |
| Female 1990 | 1.0 | 1.0 | 2.0 | 1.6 |
| Female 2000 | 1.0 | 1.0 | 2.0 | 1.5 |
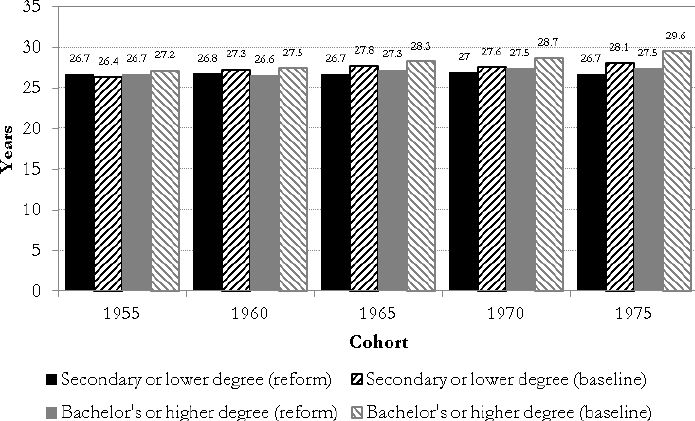
Figure 2 lists the average time spent in retirement by educational groups, in the baseline and the reform projections. One might expect that the group with a higher education would spend more time in retirement. However, the difference is small, especially in the reform projection, because the less educated people tend to retire earlier and to draw disability pensions more frequently. The differences between the educational groups in the baseline projection are in line with the results of Järnefelt et al. 2014, p. 114.

Average time spent in retirement, by education and in years.
The time spent in retirement will be lower for the future pensioner cohorts than it would be without the reform (Figure 2). However, the increasing longevity means that, despite the reform, the time spent in retirement will increase slightly from the present level. The reform will have a greater impact on the groups with a higher education. Those with a lower education are much more prone to draw a disability pension or the forthcoming years-of-service pension.
The gender differences will remain fairly stable after the reform. However, in relative terms, the time males will spend in retirement will be altered more because of their shorter life expectancy.
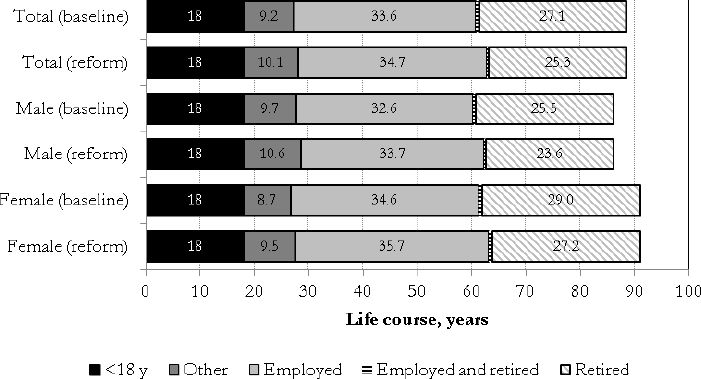
In Figure 3, we demonstrate the impacts of the reform for the 1988 birth cohort. For both genders, the average time spent in retirement will be reduced by two years because of the reform. The working lives will be extended by one year. The time spent outside of the labour force will also increase by approximately one year. This outlines the fact that postponing retirement does not have one-to-one correspondence with extending working lives. The earliest eligibility age for old-age pension for this cohort is increased by about four and half years. This means that the working lives are extended by around one fourth of the rise in the earliest pensionable age.

Partition of the life course of the 1988 birth cohort, years on average.
It may seem strange that the working lives of females are slightly longer than those of males. This is mainly due to the fact that, for technical reasons, parental leaves are typically included in the length of working lives, at least partly.
5.2 Impact on earnings-related pension levels
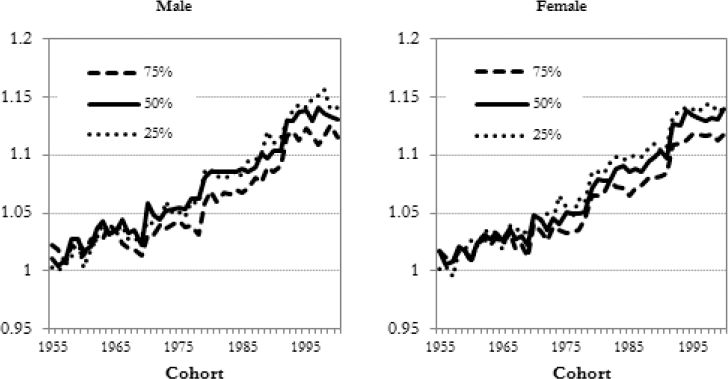
In the following we interpret how different percentage points of the earnings-related monthly pensions change as a result of the reform (Figure 4). The different groups are compared by considering the relative change of the median within each group (Figure 5).

Relative changes of the percentage points of the pension levels of 75-year-olds, by birth cohort and gender.

Relative changes of the medians of the earnings-related pensions of 75-year-olds, by gender and educational level.
For the pension levels (€/month), see appendix A.3.
It turns out that high pensions (upper quartile) will increase less than will median-sized and small pensions (lower quartile). As of the birth cohort 1975, this difference will be 2–3 percentage points. For earlier cohorts, the difference will be smaller (Figure 4). These differences are mainly a consequence of the fact that the higher accruals at the end of the working lives used to favour high-earners. In this sense, the new accrual rules are more neutral. Improving the disability pensions will also have some impact on improving the lower end of the pension distribution.
Figure 5 presents the change of the median pension levels in different educational groups. The pension levels will improve in all groups studied. However, the pensions in the lower educational group will increase approximately 2 percentage points more than in the higher educational group.
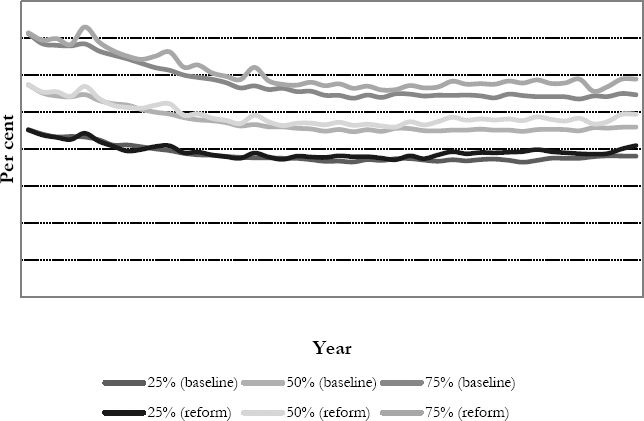
One of the main indicators of the adequacy of pensions is the replacement rate i.e. the fraction between the starting pension and the final wage. We present the development of the replacement rates by calendar years both in the baseline and the reform projections (Figure 6). We show the replacement rates in the entire statutory pension system, including also the national and the guarantee pensions. This extension improves the lowest pensions. However, low pensions may occur in any part of the replacement rate distribution as they also depend on the final wage. We decided to show the replacement rates in the whole statutory pension system in order to facilitate a comparison with other countries.9

Replacement rates of the statutory pensions 2017–2060 of people moving directly from work to old-age-pension, in per cent.
In general, all the curves shown here would be around 1 per cent lower if we only considered earnings-related pensions. The difference is so low because the people retiring from work tend to be the ones with at least a moderate earnings-related pension accrual. If we also considered starting disability pensions, the role of the national pension would be more important.
There is a decreasing trend in replacement rates in the future. There are at least two main reasons. Firstly, the life expectancy coefficient will cut the replacement rates directly if working lives are not extended. The working lives are expected to extend but not enough to compensate the impact of the cutting effect of the life expectancy coefficient. This impact is highly dependent on the assumption on the future demographic development. Secondly, the impact of the transition rule of the 2005 pension reform relating to the old final wage principle will vanish in the long run. The accrual rules applied to pre 2005 earnings are more generous in many typical cases than the present ones. As a result of the forthcoming reform, the replacement rate distribution will stabilize on a higher level than it would have done without the reform.
5.3 Impact on income distribution
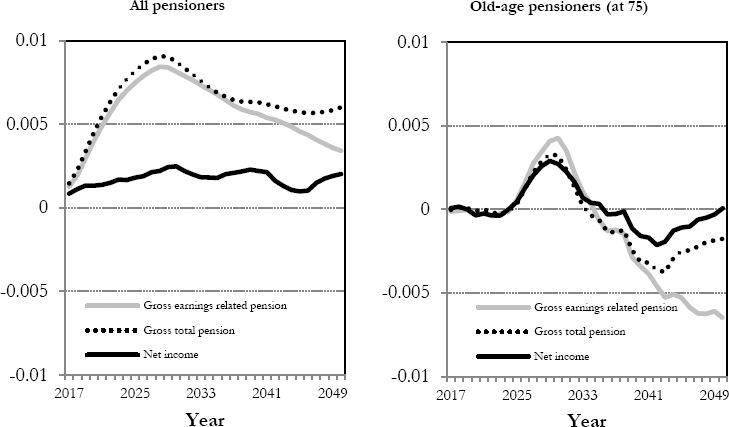
We have analysed the reform’s effect on income distribution using the Gini coefficient. The Gini coefficient is a widely used measure for income inequality. In this paper the coefficient has been computed for the pensioner population for the baseline and reform scenarios separately. We have analysed the change between these.
We have computed three different variations on the change of the Gini coefficient (Figure 7). The first one involves earnings-related pensions only, while the second includes all statutory pensions (earnings-related, national and guarantee pensions). The third variation is on the net income of the pensioner population, including also their wage income and income taxation. However, capital income, survivors’ pensions and social security benefits (other than pensions) have been excluded.

Change in Gini coefficient in 2017–2050.
The figures are computed separately for the whole pensioner population and for 75-year-old pensioners. The latter is done because the age structure of the pensioner population changes over time and the reform affects pensions for different birth cohorts in different ways (Finnish Centre for Pensions 2014).
At this scope the reform will increase the gross pension income differences in the pensioner population to some extent. Because of the growth in wages and the indexing rules, the starting pensions are higher, in general, than the ones that have been paid out for decades. The reform will even improve the starting pensions but will not alter the pensions in payment.
However, taxation and other income will overturn most of this effect since, as a result of the reform, the share of partially retired people with other income sources will grow.
For the 75-year-old pensioners, the picture is slightly different. Short term, before the year 2035 (i.e. those born before 1960), the reform will increase the income differences. After that, the result will be the opposite. This is mainly due to the fact that the disability pensions starting before the reform are in general lower than the ones starting after the reform. For the cohorts born in the 1950’s, the disability pensions have typically started already before the reform, but the pensions for these cohorts with extended working lives will improve. When comparing these results to those in Figure 4, please note the different time scale.
Overall, the impacts on the Gini coefficient are rather minor. Taxation mitigates the impact of the changes on the Gini coefficient in all populations studied.
6. Conclusions
With the help of the microsimulation model, the decision makers had better and more in-depth analyses of the impacts of the proposed reform options. During the negotiations for the pension reform (in 2014), the ELSI model was used in addition to the LTP macro model to provide additional information on the reform proposals. The forthcoming pension reform in 2017 is probably the best studied reform of the Finnish pension scheme in a long time.
As a result of the reform, working lives will be extended. However, the increase in the length of working lives will be less than the increase in the effective retirement age. The earnings-related pension levels will be higher in the future because of the reform. The younger the cohort, the greater is the impact. Within each age and gender group, the earnings-related pensions will increase slightly more in the lower than in the higher education group. In the long run, the lower earnings-related pensions will improve slightly more than the higher ones.
However, when considering the whole pensioner population, the reform will give rise to increased differences in pensions. One reason for this is that the reform will not affect pensions that have already started. Typically, the level of such pensions that have been paid out for long time is lower than average. The reform will even improve new starting pension but, in the long run, the income differences will decrease within each age group.
The results on taxation presented here are preliminary and subject to changes. The Finnish economy has faced hardships since 2008 and public finances are imbalanced. The pension reform plays a part in the balancing of public finances in the long run. However, there is a pressure to increase taxes and widen the tax bases. The pressure to increase municipality tax rates is at least 3 percentage points in 50 per cent of the municipalities (Ministry of Finance 2015b, p. 58). However, the Programme of Prime Minister Sipilä’s Government (page 8) states that the total tax rate will not increase during the current term 2015–2019. Some changes in the structure of the taxation are to be expected, however. The Government Program indicates some cuts to the indexing of the pensions. On the other hand, the level of the guarantee pension is subject to increase slightly. We have not taken the changes stated in the Government Program into account in the simulation results presented in this article.
Footnotes
1.
In some sense, the part time pension is replaced by the partial old-age pension. The partial old-age pension is considered to be more actuarial and less bureaucratic. The main differences of the benefits are the following. The old partial pension can be granted for employees who have agreed with the employers to reduce their working hours. The new partial old-age pension can be granted to any insured person working full time, part-time or not working at all. The amount of partial pension is based on the final wage. Taking the partial pension does not reduce the old-age pension later. The amount of the partial old-age pension is based on the accrued pension with actuarial reduction.
2.
The macro model is the same that is used for producing the results on the Finnish earnings-related pension system of the AWG report (European Commission 2015). The impact of the reform is not present in the AWG results.
3.
The sustainability gap refers to the additional financing (in relation to GDP) needed to balance the public sector in the long run.
4.
The duration of the working life indicator measures the number of years a person aged 15 is expected to be active in the labor market throughout his/her life.
5.
The target retirement age is higher than the earliest eligibility age. It is a psychological target rather than a parameter of the pension system or an economical incentive.
6.
The increase of the earliest eligibility age from 63 to 65 is not taken into account when redefining the life expectancy coefficient.
7.
75-year-olds are all retired in both the baseline and the reform projections.
8.
In the projection, the target retirement age is not assumed to have any impact on the retirement decisions.
9.
According to the legislation, national and guarantee pensions are indexed using the consumer price index. However, in the past, there have been decision-based improvements (and freezings) to this indexation. In the long run, we have assumed that the indexing follows price changes to 50 per cent and wage changes to 50 per cent.
10.
The accrual for the projected pensionable service is calculated from the time of the pension contingency to the time of turning 63 years.
11.
The basis for the accrual is a per-benefit-specified share of the earnings prior to the benefit period.
12.
Exceptions for the self-employed, farmers and seafarers.
13.
Survivor’s pensions are not subject to the pension reform and thus not covered in this paper.
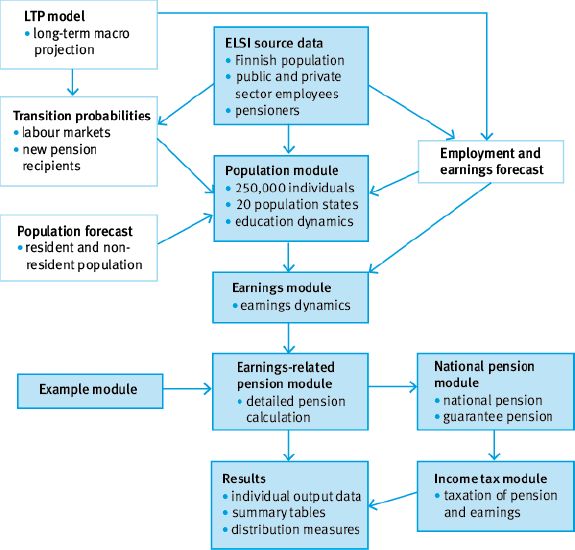
A. The model structure
The model structure is described in detail in Tikanmäki et al. (2014). Since then, we have added modules for the national and the guarantee pension, as well as for income taxation. The updated structure of the model is described in what follows.

Structure of the ELSI model. Each dark box represents a module of the model. Each white box represents an external source of information.
The national pension module is used for calculating the national pension and the guarantee pension for people whose earnings-related pensions are small or who receive no earnings-related pension at all. The national pension consists of the old-age and the disability pension. The amount of the national pension is reduced by the amount of the earnings-related pension. The national pension is smaller for those living with a spouse or partner than for those who are living alone. In the ELSI model, the marital status is stochastic so that, on average, the share of people living alone stays at the same level for each gender and age group as in the years 2008–2013. The length of time lived abroad also affects the level of the national pension. The minimum requirement is that the individual has resided in Finland for at least three years after the age of 16. The national pension is paid abroad if Finland has a social security agreement with the country in question. In addition, simulation assumptions on insurance periods in Finland and social security agreement countries greatly affected the results. In 2014, the full monthly national pension for a person living alone in Finland was approximately EUR 630 (the average monthly total pension was ca EUR 1,590 and the average monthly wage EUR 3,300).
The Act on Guarantee Pension came into force in 2011. Its purpose is to provide a minimum pension level for people living in Finland. The guarantee pension is not paid abroad. It is granted to people aged 65 or above or as a disability allowance as of the age of 16 years. The minimum residence requirement in Finland is three years. The amount of the earnings-related pension and the national pension reduce the amount of the guarantee pension. In 2014, the full monthly guarantee pension was approximately EUR 750, providing the person does not receive any other pension income.
In the microsimulation model we have not simulated survivors’ pensions and pensions paid from abroad. These factors would reduce the national and the guarantee pension. As a result of the pension reform in 2017, the earliest eligibility age for the national and the guarantee pension will rise gradually.
From a technical point of view, there were some challenges in the national pension module. In the lower income groups, the assumptions on times resided in Finland had great influence on the level of the national pension and thus the total pension level. In the long run, it is hard to estimate the proper level for the national pension.
The income tax module is used for calculating the direct taxation of wages and pension income. As a result, we have obtained the net income for each person each year. In the taxation module we use the official parameters for income taxation for the past years and the present year. These include, for example, income tax rates for different income levels and reductions. For the simulation years, we have indexed parameters using the income level index so that the future taxation level will be the same as the current with respect to the wage level. The module is purely deterministic.
The tax module includes the state tax and the municipality tax. The church tax is not included in the income tax module. Members of the Evangelical Lutheran Church or Orthodox Church pay an average monthly church tax of 1.43 per cent of the wages). In practice, 73 per cent of the Finnish population belongs to the Evangelical Lutheran Church. Among the older cohorts (65+ yrs.), 82 per cent are enrolled with the Church (Statistics Finland 2014).
A. Current earnings-related pension rules in a nutshell
Accrual rules
Earnings-related pension accrues from income earned between the ages of 18 and 67 in accordance with the following accrual rates:
1.5 per cent of earnings for people between 18 and 52 years old.
1.9 per cent of earnings for people between 53 and 62 years old.
4.5 per cent of earnings for people between 63 and 67 years old.
1.5 per cent of earnings during retirement.
1.5 per cent of earnings for projected pensionable service10
1.5 per cent of certain social security benefits11.
Persons under the age of 18 and persons aged 68 or above do not accrue a pension, nor do they fall under the insurance obligation. The income that accrues a pension equals the salary from which the employee’s pension contribution has been deducted12. Pension accrues during the following social benefit periods: earnings-related unemployment allowance and labour market training periods, parental allowance, sickness allowance and job alternation leave periods. Earnings-related pension also accrues from a few other benefit periods that are less significant from the point of view of pension expenditure.
Regardless of age, the accrual rate for social benefit periods is 1.5 per cent per year. The accrual is based on the same earnings that the actual benefit is based on. For the parental allowance, the basis for the pension is 117 per cent of the earnings; for earnings-related unemployment benefits, the percentage is 75, and for other types of daily allowance, except job alternation leave, the percentage is 65. For job alternation leave, the basis for the pension is 55 per cent of the earnings.
Pension accrues also from studies leading to a vocational or university-level degree, as well as from child care at home for children under the age of three. This accrued pension is calculated using an earnings base of EUR 676 per month, at 2012 prices, with an annual accrual rate of 1.5 per cent. The earnings base is indexed to the wage coefficient.
Indexing
When calculating the initial pension amount, the income from different years is adjusted using the wage coefficient, which is a weighted average equal to 80 per cent of wage changes and 20 per cent of price changes. Pensions in payment are adjusted using an earnings-related pension index, which is a weighted average equal to 20 per cent of wage changes and 80 per cent of price changes. A one-time raise in pension is carried out for young and middle-aged disability pensioners after the pension has been paid for five years. The increase is 25 per cent for pensioners under the age of 32. For those over 32, the increase will be lowered by one percentage point for each year of age, until it ceases altogether.
Pension benefits
Earnings-related pension benefits include disability, part-time, old-age and survivors’ pensions.13
Disability pension
Disability pension can be granted either as a full pension or a partial pension, depending on the degree to which the work ability of the insured has decreased. The partial disability pension is equal to half of the full disability pension. The disability pension is equal to the pension accrued up to the date on which the disability occurred, plus an additional amount based on projected pensionable service. Projected pensionable service is calculated from the time of the pension contingency until the time of turning 63. The annual accrual rate applied to the projected pensionable service is 1.5 per cent, and the salary applied is the average salary computed over the five years preceding the occurrence of the disability. The life expectancy coefficient affects the starting amount of the disability pension as explained later in this appendix.
Part-time pension
A part-time pension may be granted to insured persons who reduce their working hours in such a manner that the earnings decrease to 35−70 per cent of their stabilised earnings level. The age limit for a part-time pension is 58 years for those born in 1952 or earlier; 60 years for those born in 1953 and 61 years for those born in 1954 or later. The size of the part-time pension is half of the earnings reduction caused by the decrease in working hours. Pension is accrued in a regular manner from work carried out during part-time pension. This pension benefit will be discontinued as a result of the reform.
Old-age pension
The insured are entitled to an old-age pension at the age of 63. In some special cases, the age limit of old-age pension may be lower than 63 years. If the insured continues to work after turning 63 and do not take out old-age pension, the pension accrual rate is 4.5 per cent per year. However, for those who engage in gainful employment while receiving a pension, the accrual rate is 1.5 per cent per year. After reaching the age of 68, the pension accrual and the insurance obligation end. If the insured do not take out their old-age pension after turning 68, an increment for deferred retirement of 0.4 per cent per month is added to the pension.
Life expectancy coefficient
Using the life expectancy coefficient, the initial amount of old-age pension and disability pension is adjusted to reflect changes in life expectancy at age 62. The starting amount of old-age pension is determined by multiplying the accrued pension by the life expectancy coefficient. For starting disability pensions, the accrued pension is also multiplied by the life expectancy coefficient. However, the coefficient is not applied to the projected pensionable service. Hence, the closer to the age of old-age pension the individual is when becoming disabled, the larger is the effect of the life expectancy coefficient on the size of the disability pension. The life expectancy coefficient is defined in such a way that the capital value (actuarial present value) of the old-age pension remains unchanged, even if the mortality of those of a pensionable age were to differ from the mortality observed in the years 2003−2007. The life expectancy coefficient affects the pensions of those born in 1948 and later. The value of the coefficient is determined separately for each birth cohort.
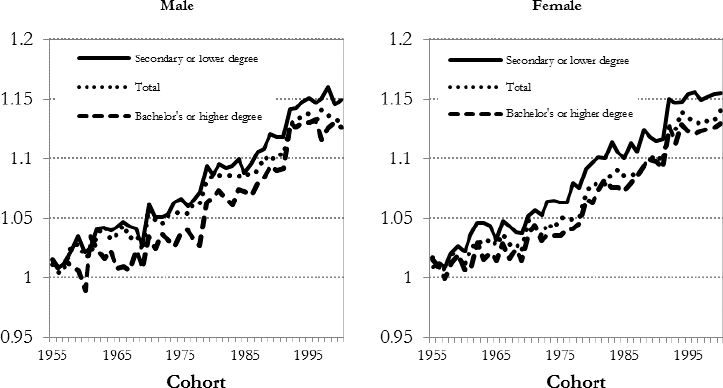
A. Earnings related pension by education
Earnings related pension by education, median EUR/month at 2014 prices*.
| Cohort | Male | Female | ||||
|---|---|---|---|---|---|---|
| 25% (baseline) | 50% (baseline) | 75% (baseline) | 25% (baseline) | 50% (baseline) | 75% (baseline) | |
| 1960 | 1,240 | 1,790 | 2,470 | 1,050 | 1,500 | 1,960 |
| 1970 | 1,440 | 1,960 | 2,650 | 1,220 | 1,640 | 2,140 |
| 1980 | 1,640 | 2,180 | 2,900 | 1,470 | 1,950 | 2,610 |
| 1990 | 1,930 | 2,510 | 3,350 | 1,700 | 2,210 | 2,880 |
| 2000 | 2,350 | 3,010 | 3,960 | 2,050 | 2,610 | 3,400 |
| 25% (reform) | 50% (reform) | 75% (reform) | 25% (reform) | 50% (reform) | 75% (reform) | |
| 1960 | 1,250 | 1,820 | 2,500 | 1,080 | 1,520 | 1,970 |
| 1970 | 1,490 | 2,070 | 2,740 | 1,270 | 1,720 | 2,230 |
| 1980 | 1,780 | 2,370 | 3,110 | 1,590 | 2,110 | 2,780 |
| 1990 | 2,150 | 2,770 | 3,640 | 1,880 | 2,430 | 3,110 |
| 2000 | 2,680 | 3,410 | 4,420 | 2,330 | 2,980 | 3,800 |
| Low (baseline) | High (baseline) | Total (baseline) | Low (baseline) | High (baseline) | Total (baseline) | |
| 1960 | 1,550 | 2,610 | 1,790 | 1,230 | 1,890 | 1,500 |
| 1970 | 1,670 | 2,780 | 1,960 | 1,270 | 2,000 | 1,640 |
| 1980 | 1,960 | 3,170 | 2,180 | 1,550 | 2,500 | 1,950 |
| 1990 | 2,250 | 3,670 | 2,510 | 1,820 | 2,720 | 2,210 |
| 2000 | 2,740 | 4,340 | 3,010 | 2,190 | 3,250 | 2,610 |
| Low (reform) | High (reform) | Total (reform) | Low (reform) | High (reform) | Total (reform) | |
| 1960 | 1,590 | 2,590 | 1,820 | 1,250 | 1,900 | 1,520 |
| 1970 | 1,780 | 2,870 | 2,070 | 1,340 | 2,080 | 1,720 |
| 1980 | 2,130 | 3,390 | 2,370 | 1,700 | 2,660 | 2,110 |
| 1990 | 2,520 | 4,002 | 2,770 | 2,030 | 2,980 | 2,430 |
| 2000 | 3,150 | 4,880 | 3,410 | 2,530 | 3,680 | 2,980 |
-
*
Low=Secondary or lower degree, High=Bachelor’s or higher degree.
References
- 1
-
2
Pension reforms: Longevity and retirementIn: T Valkonen, V Vihriälä, editors. The Nordic model – challenged but capable of reform, 2014. Nordic Council of Ministers 2014, TemaNord. 531.
-
3
Finnish Centre for Pensions, Evaluation of the Finnish Pension System / Part 1Finnish Centre for Pensions, Evaluation of the Finnish Pension System / Part 1.
-
4
The 2015 Ageing Report: Economic and budgetary projections for the 28 EU Member States (2013–2060)The 2015 Ageing Report: Economic and budgetary projections for the 28 EU Member States (2013–2060).
-
5
http://ec.europa.eu/eurostat/tgm/table.do?tab=table&init=1&language=en&pcode=tsdde420&plugin=1Duration of working life.
-
6
http://valtioneuvosto.fi/documents/10184/1427398/Ratkaisujen+Suomi_EN_YHDISTETTY_netti.pdf/8d2e1a66-e24a-4073-8303-ee3127fbfcacStrategic Programme of Prime Minister Juha Sipilä’s Government, 29 May 2015.
-
7
http://www.etk.fi/wp-content/uploads/etk_vaikutusarvio_26092104_hn2_en-1.pdfPreliminary consequence analysis of the results of the 2017 pension reform negotiations.
-
8
How do earnings-related pensions develop? Calculations until 2050. Finnish Centre for Pensions, Reports 2006:1How do earnings-related pensions develop? Calculations until 2050. Finnish Centre for Pensions, Reports 2006:1.
-
9
Sosioekonomiset erot – työurat, eläkkeelle siirtyminen ja eläkejärjestelmä (In Finnish). Finnish Centre for Pensions, reports 01/2014Sosioekonomiset erot – työurat, eläkkeelle siirtyminen ja eläkejärjestelmä (In Finnish). Finnish Centre for Pensions, reports 01/2014.
-
10
Laskelmia vuoden 2017 työeläkeuudistuksen vaikutuksista (In Finnish). Finnish Centre for Pensions, reports 02/2015Laskelmia vuoden 2017 työeläkeuudistuksen vaikutuksista (In Finnish). Finnish Centre for Pensions, reports 02/2015.
-
11
Työeläkeuudistus 2017: vaikutukset työuriin, tulonjakoon ja julkisen talouden kestävyyteen (In Finnish)Valtioneuvoston selvitys-ja tutkimustoiminnan julkaisusarja 1/2015.
-
12
The Finnish Pension Reform of 2005The Geneva Papers on Risk and Insurance. Issues and Practice, 32, 1.
-
13
Longevity, Working Lives and Public Finances. ETLA Working Papers no 24, 9 April 2014The Research Institute of the Finnish Economy.
- 14
-
15
Valtiovarainministeriön julkaisu – 16a/2015Valtiovarainministeriön julkaisu – 16a/2015.
-
16
Finnish Centre for Pensions, Reviews 02/2014Finnish Centre for Pensions, Reviews 02/2014.
-
17
Statutory pensions in Finland - long-term projections 2013. Finnish Centre for Pensions, Reports 03/2014Statutory pensions in Finland - long-term projections 2013. Finnish Centre for Pensions, Reports 03/2014.
-
18
http://www.stat.fiPopulation projection 2012−2060.
- 19
-
20
Microsimulating Finnish earnings-related pensions. Finnish Centre for Pensions, Working Papers 02/2014Microsimulating Finnish earnings-related pensions. Finnish Centre for Pensions, Working Papers 02/2014.
Article and author information
Author details
Publication history
- Version of Record published: December 31, 2015 (version 1)
Copyright
© 2015, Tikanmäki et al.
This article is distributed under the terms of the Creative Commons Attribution License, which permits unrestricted use and redistribution provided that the original author and source are credited.